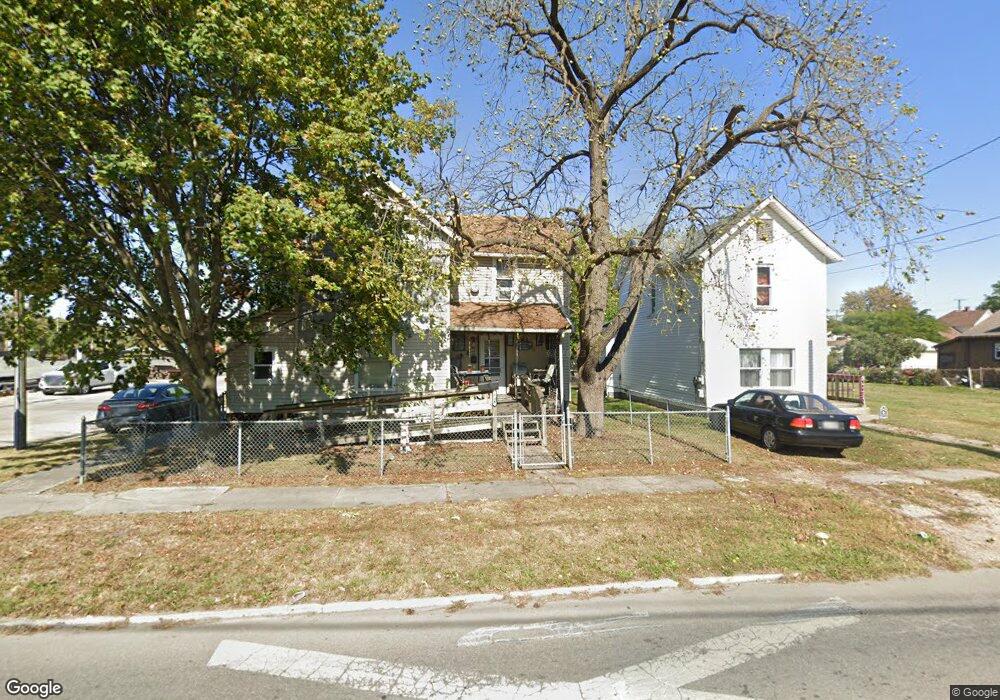
344 Chester St Marion, OH 43302
Estimated Value: $41,000 - $99,000
2
Beds
1
Bath
860
Sq Ft
$88/Sq Ft
Est. Value
About This Home
This home is located at 344 Chester St, Marion, OH 43302 and is currently estimated at $75,340, approximately $87 per square foot. 344 Chester St is a home located in Marion County with nearby schools including Rutherford B. Hayes Elementary School, Ulysses S. Grant Middle School, and Harding High School.
Ownership History
Date
Name
Owned For
Owner Type
Purchase Details
Closed on
May 2, 2025
Sold by
Daso Eric G and Daso James A
Bought by
Daso Christopher L and Daso Kaitlynn
Current Estimated Value
Home Financials for this Owner
Home Financials are based on the most recent Mortgage that was taken out on this home.
Original Mortgage
$55,453
Outstanding Balance
$55,255
Interest Rate
6.62%
Mortgage Type
FHA
Estimated Equity
$20,085
Purchase Details
Closed on
Sep 10, 2020
Sold by
Cook Michael N and Cook Deborah S
Bought by
Daso G Eugene
Purchase Details
Closed on
Jul 22, 2003
Bought by
Cook Michael N and Surv Deborah S
Create a Home Valuation Report for This Property
The Home Valuation Report is an in-depth analysis detailing your home's value as well as a comparison with similar homes in the area
Home Values in the Area
Average Home Value in this Area
Purchase History
| Date | Buyer | Sale Price | Title Company |
|---|---|---|---|
| Daso Christopher L | $35,000 | Mutual Title | |
| Daso Christopher L | $35,000 | Mutual Title | |
| Daso G Eugene | $30,000 | None Available | |
| Cook Michael N | $14,000 | -- |
Source: Public Records
Mortgage History
| Date | Status | Borrower | Loan Amount |
|---|---|---|---|
| Open | Daso Christopher L | $55,453 | |
| Closed | Daso Christopher L | $55,453 |
Source: Public Records
Tax History Compared to Growth
Tax History
| Year | Tax Paid | Tax Assessment Tax Assessment Total Assessment is a certain percentage of the fair market value that is determined by local assessors to be the total taxable value of land and additions on the property. | Land | Improvement |
|---|---|---|---|---|
| 2024 | $780 | $15,830 | $1,140 | $14,690 |
| 2023 | $780 | $15,830 | $1,140 | $14,690 |
| 2022 | $551 | $15,830 | $1,140 | $14,690 |
| 2021 | $475 | $12,290 | $990 | $11,300 |
| 2020 | $489 | $12,290 | $990 | $11,300 |
| 2019 | $488 | $12,290 | $990 | $11,300 |
| 2018 | $484 | $12,190 | $980 | $11,210 |
| 2017 | $491 | $12,190 | $980 | $11,210 |
| 2016 | $487 | $12,190 | $980 | $11,210 |
| 2015 | $487 | $11,930 | $930 | $11,000 |
| 2014 | $489 | $11,930 | $930 | $11,000 |
| 2012 | $574 | $13,960 | $980 | $12,980 |
Source: Public Records
Map
Nearby Homes
- 468 Avondale Ave
- 473 Avondale Ave
- 343 Commercial St
- 678 Marshall St
- 178 Leader St
- 347 Mary St
- 531 Toledo Ave
- 551 Universal Ave Unit 555
- 236 Silver St
- 434 Scranton Ave
- 641 Blake Ave
- 565 Milburn Ave
- 325 Holmes Place
- 523 Thompson St
- 395 N Main St
- 355 Lee St
- 375 N Main St
- 552 N Prospect St
- 198 Windsor St
- 374 Nunin Ct