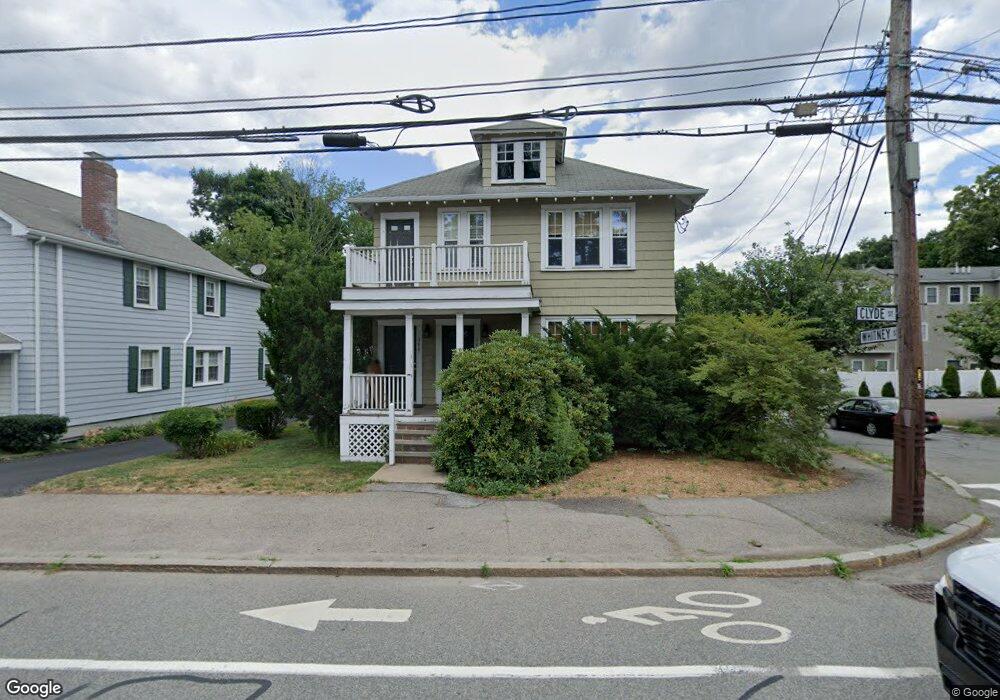
344 Clyde St Unit 346 Chestnut Hill, MA 02467
South Brookline NeighborhoodEstimated Value: $1,519,000 - $1,808,000
5
Beds
2
Baths
2,896
Sq Ft
$583/Sq Ft
Est. Value
About This Home
This home is located at 344 Clyde St Unit 346, Chestnut Hill, MA 02467 and is currently estimated at $1,689,767, approximately $583 per square foot. 344 Clyde St Unit 346 is a home located in Norfolk County with nearby schools including Heath Elementary School, Brookline High School, and Dexter School.
Ownership History
Date
Name
Owned For
Owner Type
Purchase Details
Closed on
Mar 1, 1990
Sold by
Goldstein Tr Alvin
Bought by
Luby Steven C
Current Estimated Value
Home Financials for this Owner
Home Financials are based on the most recent Mortgage that was taken out on this home.
Original Mortgage
$10,000
Interest Rate
9.78%
Create a Home Valuation Report for This Property
The Home Valuation Report is an in-depth analysis detailing your home's value as well as a comparison with similar homes in the area
Home Values in the Area
Average Home Value in this Area
Purchase History
| Date | Buyer | Sale Price | Title Company |
|---|---|---|---|
| Luby Steven C | $266,000 | -- |
Source: Public Records
Mortgage History
| Date | Status | Borrower | Loan Amount |
|---|---|---|---|
| Open | Luby Steven C | $275,250 | |
| Closed | Luby Steven C | $10,000 | |
| Closed | Luby Steven C | $239,400 |
Source: Public Records
Tax History Compared to Growth
Tax History
| Year | Tax Paid | Tax Assessment Tax Assessment Total Assessment is a certain percentage of the fair market value that is determined by local assessors to be the total taxable value of land and additions on the property. | Land | Improvement |
|---|---|---|---|---|
| 2025 | $15,191 | $1,539,100 | $498,800 | $1,040,300 |
| 2024 | $15,112 | $1,546,800 | $479,500 | $1,067,300 |
| 2023 | $14,985 | $1,503,000 | $436,100 | $1,066,900 |
| 2022 | $14,586 | $1,431,400 | $415,300 | $1,016,100 |
| 2021 | $13,488 | $1,376,300 | $399,300 | $977,000 |
| 2020 | $13,003 | $1,376,000 | $363,000 | $1,013,000 |
| 2019 | $12,278 | $1,310,400 | $345,700 | $964,700 |
| 2018 | $10,847 | $1,146,600 | $293,600 | $853,000 |
| 2017 | $10,490 | $1,061,700 | $277,000 | $784,700 |
| 2016 | $8,914 | $855,500 | $258,800 | $596,700 |
| 2015 | $8,305 | $777,600 | $241,800 | $535,800 |
| 2014 | $8,451 | $742,000 | $222,500 | $519,500 |
Source: Public Records
Map
Nearby Homes
- 291 Goddard Ave
- 303 Goddard Ave
- 382 Lee St
- 333 Lee St
- 79 Goddard Ave
- 4 Benjamin Place
- 71 Sears Rd
- 91 Grove St
- 280 Warren St
- 11 Furnival Rd
- 39 Clyde St
- 75 Goddard Ave
- 50 Bellingham Rd
- 63 Goddard Ave
- 1069 W Roxbury Pkwy
- 2 Rockwood Terrace
- 83 Payson Rd
- 372 Warren St
- 50 Hackensack Rd
- 232 Allandale Rd Unit 2D