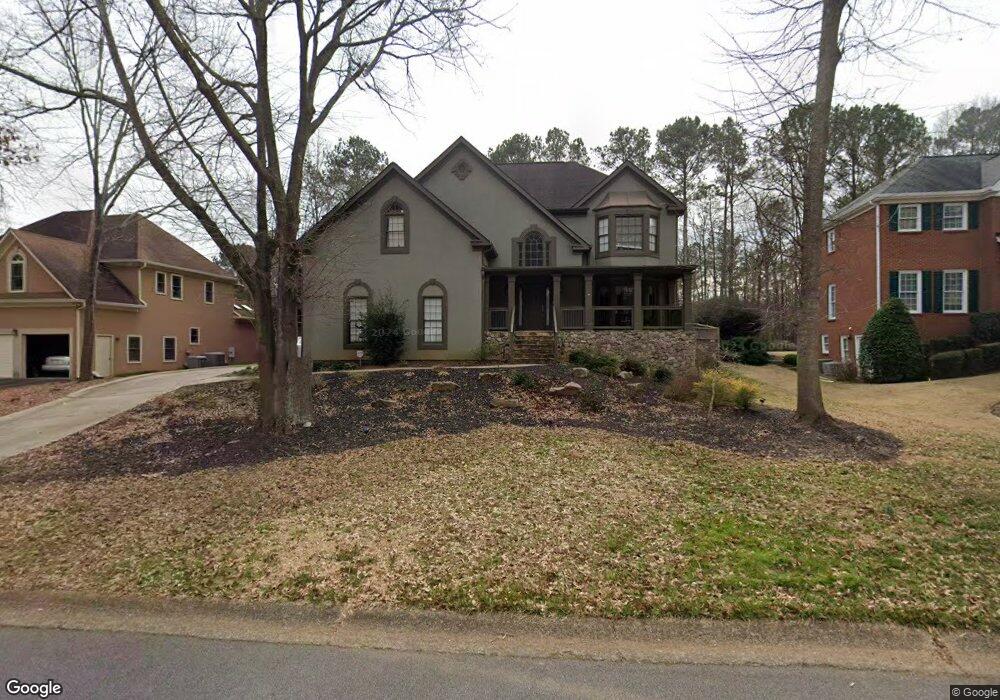
344 Covered Bridge Place SW Smyrna, GA 30082
Estimated Value: $526,000 - $641,000
4
Beds
3
Baths
3,100
Sq Ft
$190/Sq Ft
Est. Value
About This Home
This home is located at 344 Covered Bridge Place SW, Smyrna, GA 30082 and is currently estimated at $590,143, approximately $190 per square foot. 344 Covered Bridge Place SW is a home located in Cobb County with nearby schools including Russell Elementary School, Floyd Middle School, and Covered Bridge Academy.
Ownership History
Date
Name
Owned For
Owner Type
Purchase Details
Closed on
Apr 1, 2019
Sold by
Bearden Rebecca Lewis
Bought by
Bearden Rebecca
Current Estimated Value
Home Financials for this Owner
Home Financials are based on the most recent Mortgage that was taken out on this home.
Original Mortgage
$365,791
Outstanding Balance
$235,546
Interest Rate
4.3%
Mortgage Type
FHA
Estimated Equity
$354,597
Purchase Details
Closed on
Jun 7, 2012
Sold by
Bearden James Wesley
Bought by
Bearden Rebecca Lewis
Create a Home Valuation Report for This Property
The Home Valuation Report is an in-depth analysis detailing your home's value as well as a comparison with similar homes in the area
Home Values in the Area
Average Home Value in this Area
Purchase History
| Date | Buyer | Sale Price | Title Company |
|---|---|---|---|
| Bearden Rebecca | -- | -- | |
| Bearden Rebecca Lewis | -- | -- |
Source: Public Records
Mortgage History
| Date | Status | Borrower | Loan Amount |
|---|---|---|---|
| Open | Bearden Rebecca | $365,791 |
Source: Public Records
Tax History Compared to Growth
Tax History
| Year | Tax Paid | Tax Assessment Tax Assessment Total Assessment is a certain percentage of the fair market value that is determined by local assessors to be the total taxable value of land and additions on the property. | Land | Improvement |
|---|---|---|---|---|
| 2025 | $1,130 | $210,248 | $56,000 | $154,248 |
| 2024 | $1,134 | $210,248 | $56,000 | $154,248 |
| 2023 | $871 | $191,100 | $50,000 | $141,100 |
| 2022 | $1,001 | $165,784 | $36,000 | $129,784 |
| 2021 | $1,001 | $165,784 | $36,000 | $129,784 |
| 2020 | $972 | $156,164 | $36,000 | $120,164 |
| 2019 | $3,354 | $138,780 | $32,000 | $106,780 |
| 2018 | $3,354 | $138,780 | $32,000 | $106,780 |
| 2017 | $2,599 | $108,424 | $32,000 | $76,424 |
| 2016 | $2,604 | $108,424 | $32,000 | $76,424 |
| 2015 | $2,659 | $108,424 | $32,000 | $76,424 |
| 2014 | $2,676 | $108,424 | $0 | $0 |
Source: Public Records
Map
Nearby Homes
- 347 Covered Bridge Place SW
- 3951 Covered Bridge Rd SW
- 321 Covered Bridge Place SW
- 4066 Covered Bridge Rd SW
- 482 Majestic Oaks Place
- 3811 S Hurt Rd SW
- 585 Lawton Bridge Rd SW
- 2508 Haddenham Ln SW
- 589 Lawton Bridge Rd SW
- 4055 Hill House Rd SW
- 3690 Herren Dr SW
- 63 Geraldine Dr SE
- 22 Geraldine Dr SE
- 18 Geraldine Dr SE
- 14 Geraldine Dr SE
- 3937 Covey Flush Ct SW Unit 25
- 3933 Covey Flush Ct SW Unit 25
- 3966 Covey Flush Ct SW Unit 20
- 3815 Felton Hill Rd Unit 15
- 3898 High Dove Way SW Unit 12
- 346 Covered Bridge Place SW
- 342 Covered Bridge Place SW
- 339 Covered Bridge Place SW
- 341 Covered Bridge Place SW
- 348 Covered Bridge Place SW Unit 1
- 337 Covered Bridge Place SW
- 343 Covered Bridge Place SW
- 330 Covered Bridge Place SW
- 335 Covered Bridge Place SW Unit 120
- 335 Covered Bridge Place SW
- 335 SW Covered Bridge
- 345 Covered Bridge Place SW
- 328 Covered Bridge Place SW
- 331 Covered Bridge Place SW
- 382 Bridgebrook Ln SW
- 380 Bridgebrook Ln SW Unit 1
- 378 Bridgebrook Ln SW Unit 1
- 384 Bridgebrook Ln SW
- 376 Bridgebrook Ln SW Unit IV
- 329 Covered Bridge Place SW