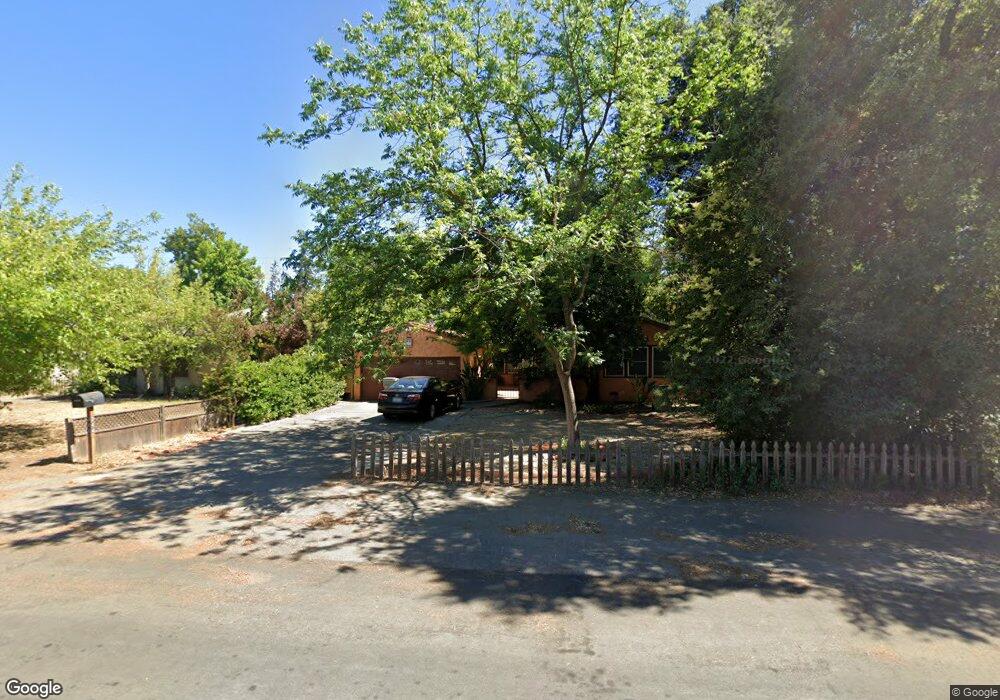
344 E Lansing Way Fresno, CA 93704
Fig Garden NeighborhoodEstimated Value: $400,000 - $468,000
2
Beds
2
Baths
1,753
Sq Ft
$249/Sq Ft
Est. Value
About This Home
This home is located at 344 E Lansing Way, Fresno, CA 93704 and is currently estimated at $436,086, approximately $248 per square foot. 344 E Lansing Way is a home located in Fresno County with nearby schools including Powers-Ginsburg Elementary, Bullard High School, and Aspen Meadow Public School.
Create a Home Valuation Report for This Property
The Home Valuation Report is an in-depth analysis detailing your home's value as well as a comparison with similar homes in the area
Home Values in the Area
Average Home Value in this Area
Tax History Compared to Growth
Tax History
| Year | Tax Paid | Tax Assessment Tax Assessment Total Assessment is a certain percentage of the fair market value that is determined by local assessors to be the total taxable value of land and additions on the property. | Land | Improvement |
|---|---|---|---|---|
| 2025 | $4,689 | $270,523 | $108,206 | $162,317 |
| 2023 | $4,689 | $260,020 | $104,005 | $156,015 |
| 2022 | $4,485 | $254,922 | $101,966 | $152,956 |
| 2021 | $4,306 | $249,924 | $99,967 | $149,957 |
| 2020 | $4,224 | $247,362 | $98,942 | $148,420 |
| 2019 | $4,157 | $242,512 | $97,002 | $145,510 |
| 2018 | $4,031 | $237,757 | $95,100 | $142,657 |
| 2017 | $3,938 | $233,096 | $93,236 | $139,860 |
| 2016 | $3,807 | $228,526 | $91,408 | $137,118 |
| 2015 | $3,736 | $225,094 | $90,035 | $135,059 |
| 2014 | $3,674 | $220,686 | $88,272 | $132,414 |
Source: Public Records
Map
Nearby Homes
- 3932 N Safford Ave
- 556 E Pontiac Way
- 3723 N Van Ness Blvd
- 311 E Dayton Ave
- 94 E Sussex Way
- 82 E Sussex Way
- 32 E Fedora Ave
- 203 W Dakota Ave
- 145 W Robinson Ave
- 830 E Beverly Way
- 146 E Fountain Way
- 4175 N Van Ness Blvd
- 822 E Dayton Ave
- B N Fruit Ave
- 1020 E Saginaw Way
- 935 E Fedora Ave
- A N Fruit Ave
- 345 W Dayton Ave
- 3725 N Fruit Ave Unit B
- 3749 N Fruit Ave Unit A
- 404 E Lansing Way
- 328 E Lansing Way
- 414 E Lansing Way
- 424 E Lansing Way
- 405 E Lansing Way
- 351 E Lansing Way
- 306 E Lansing Way
- 421 E Lansing Way
- 3835 N Wilson Ave
- 3835 N Wilson Ave
- 303 E Lansing Way
- 400 E Saginaw Way
- 3865 N Wilson Ave
- 326 E Saginaw Way
- 419 Circle Dr N
- 420 E Saginaw Way
- 415 Circle Dr N
- 308 E Saginaw Way
- 425 Circle Dr N
- 3887 N Wilson Ave