Estimated Value: $256,000 - $306,000
3
Beds
2
Baths
1,140
Sq Ft
$243/Sq Ft
Est. Value
About This Home
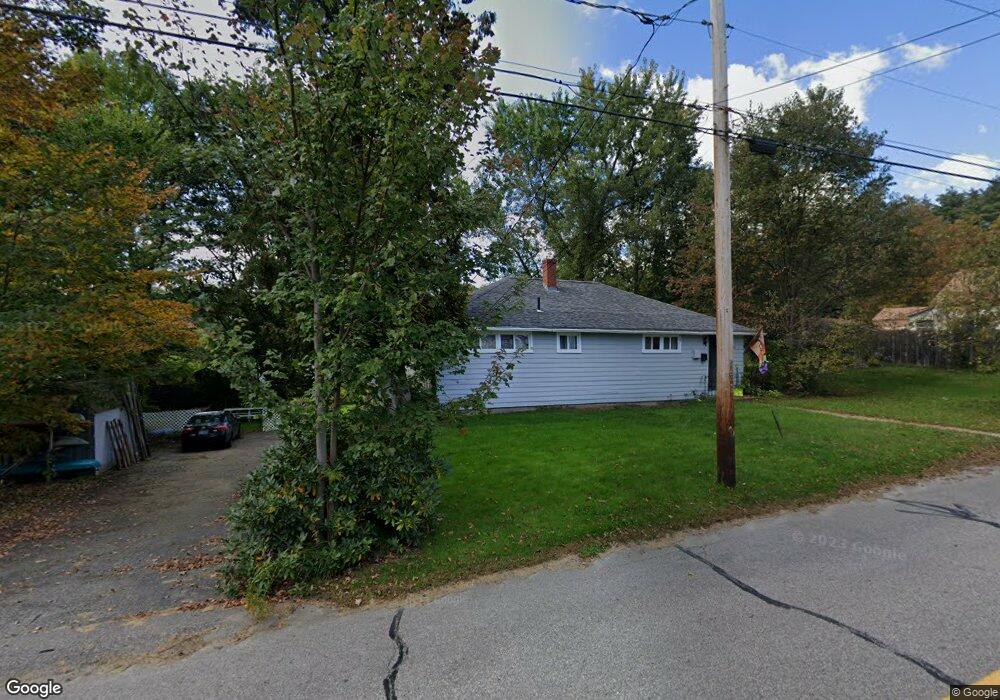
This home is located at 344 Elm St, Keene, NH 03431 and is currently estimated at $276,456, approximately $242 per square foot. 344 Elm St is a home located in Cheshire County with nearby schools including Franklin Elementary School, Keene Middle School, and Mitchell High School.
Ownership History
Date
Name
Owned For
Owner Type
Purchase Details
Closed on
Jan 21, 2021
Sold by
Ropiecki Ret and Ropiecki
Bought by
Adams Andrew I and Adams Theresa S
Current Estimated Value
Home Financials for this Owner
Home Financials are based on the most recent Mortgage that was taken out on this home.
Original Mortgage
$141,329
Outstanding Balance
$126,137
Interest Rate
2.71%
Mortgage Type
Purchase Money Mortgage
Estimated Equity
$150,319
Purchase Details
Closed on
Mar 7, 2011
Sold by
Fnma
Bought by
Ropiecki Allen W and Ropiecki Barbara L
Purchase Details
Closed on
Sep 29, 2010
Sold by
Breen Todd B and Fnma
Bought by
Federal National Mortgage Association
Purchase Details
Closed on
Oct 14, 2003
Sold by
Sterling Edward C and Sterling James A
Bought by
Breen Todd B
Home Financials for this Owner
Home Financials are based on the most recent Mortgage that was taken out on this home.
Original Mortgage
$125,000
Interest Rate
6.35%
Mortgage Type
Purchase Money Mortgage
Create a Home Valuation Report for This Property
The Home Valuation Report is an in-depth analysis detailing your home's value as well as a comparison with similar homes in the area
Home Values in the Area
Average Home Value in this Area
Purchase History
| Date | Buyer | Sale Price | Title Company |
|---|---|---|---|
| Adams Andrew I | $145,733 | None Available | |
| Ropiecki Allen W | $60,000 | -- | |
| Federal National Mortgage Association | $142,300 | -- | |
| Breen Todd B | $125,000 | -- |
Source: Public Records
Mortgage History
| Date | Status | Borrower | Loan Amount |
|---|---|---|---|
| Open | Adams Andrew I | $141,329 | |
| Previous Owner | Breen Todd B | $125,000 |
Source: Public Records
Tax History Compared to Growth
Tax History
| Year | Tax Paid | Tax Assessment Tax Assessment Total Assessment is a certain percentage of the fair market value that is determined by local assessors to be the total taxable value of land and additions on the property. | Land | Improvement |
|---|---|---|---|---|
| 2024 | $5,817 | $175,900 | $43,200 | $132,700 |
| 2023 | $5,609 | $175,900 | $43,200 | $132,700 |
| 2022 | $5,458 | $175,900 | $43,200 | $132,700 |
| 2021 | $5,502 | $175,900 | $43,200 | $132,700 |
| 2020 | $5,189 | $139,200 | $50,600 | $88,600 |
| 2019 | $5,234 | $139,200 | $50,600 | $88,600 |
| 2018 | $5,167 | $139,200 | $50,600 | $88,600 |
| 2017 | $5,181 | $139,200 | $50,600 | $88,600 |
| 2016 | $5,065 | $139,200 | $50,600 | $88,600 |
Source: Public Records
Map
Nearby Homes
- 67 Woodburn St
- 50 Forest St
- 49-51 Howard St
- 0 Stevens St Unit 1
- 13 Brook St
- 77 Franklin St
- 91 Sullivan St
- 17 Meetinghouse Rd
- 37 Church St Unit 3
- 2C Valley Creek Ln Unit 2C
- 7 Newman St
- 39 Windsor Ct Unit B
- 57 Winchester St
- 14 Foster St
- 232 Winchester St
- 22 Fairfield Ct
- 15 Jennison St
- 316 Perk St
- 45 Blossom St
- 194 Marlboro St