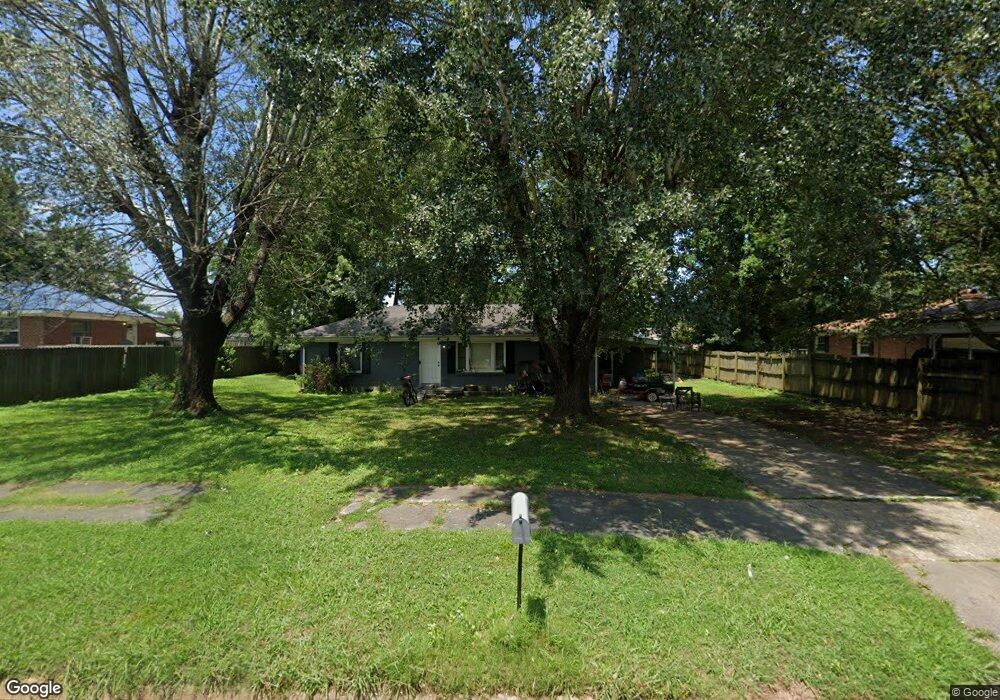
344 Groh St Lawrenceburg, TN 38464
Estimated Value: $155,863 - $209,000
--
Bed
1
Bath
1,175
Sq Ft
$152/Sq Ft
Est. Value
About This Home
This home is located at 344 Groh St, Lawrenceburg, TN 38464 and is currently estimated at $178,466, approximately $151 per square foot. 344 Groh St is a home located in Lawrence County with nearby schools including Ingram Sowell Elementary School, David Crockett Elementary School, and Lawrenceburg Public Elementary School.
Ownership History
Date
Name
Owned For
Owner Type
Purchase Details
Closed on
Dec 5, 2008
Sold by
Masscy Samuel
Bought by
Williams Gary E
Current Estimated Value
Home Financials for this Owner
Home Financials are based on the most recent Mortgage that was taken out on this home.
Original Mortgage
$62,672
Interest Rate
6.1%
Purchase Details
Closed on
Apr 1, 2008
Sold by
Bank Of America Na
Bought by
Samuel Masscy
Home Financials for this Owner
Home Financials are based on the most recent Mortgage that was taken out on this home.
Original Mortgage
$35,000
Interest Rate
6.03%
Purchase Details
Closed on
Jul 3, 2007
Bought by
Bank Of America Na
Purchase Details
Closed on
Sep 6, 1989
Bought by
Hernandeze Ruth
Purchase Details
Closed on
Nov 30, 1981
Bought by
Seymore Jackie and Seymore Wife
Create a Home Valuation Report for This Property
The Home Valuation Report is an in-depth analysis detailing your home's value as well as a comparison with similar homes in the area
Home Values in the Area
Average Home Value in this Area
Purchase History
| Date | Buyer | Sale Price | Title Company |
|---|---|---|---|
| Williams Gary E | $63,500 | -- | |
| Samuel Masscy | $28,000 | -- | |
| Bank Of America Na | -- | -- | |
| Hernandeze Ruth | $25,500 | -- | |
| Seymore Jackie | -- | -- |
Source: Public Records
Mortgage History
| Date | Status | Borrower | Loan Amount |
|---|---|---|---|
| Closed | Seymore Jackie | $62,672 | |
| Previous Owner | Seymore Jackie | $35,000 |
Source: Public Records
Tax History Compared to Growth
Tax History
| Year | Tax Paid | Tax Assessment Tax Assessment Total Assessment is a certain percentage of the fair market value that is determined by local assessors to be the total taxable value of land and additions on the property. | Land | Improvement |
|---|---|---|---|---|
| 2025 | $863 | $27,750 | $0 | $0 |
| 2024 | $863 | $27,750 | $2,500 | $25,250 |
| 2023 | $863 | $27,750 | $2,500 | $25,250 |
| 2022 | $863 | $27,750 | $2,500 | $25,250 |
| 2021 | $730 | $16,600 | $2,500 | $14,100 |
| 2020 | $730 | $16,600 | $2,500 | $14,100 |
| 2019 | $730 | $16,600 | $2,500 | $14,100 |
| 2018 | $730 | $16,600 | $2,500 | $14,100 |
| 2017 | $730 | $16,600 | $2,500 | $14,100 |
| 2016 | $730 | $16,600 | $2,500 | $14,100 |
| 2015 | $691 | $16,600 | $2,500 | $14,100 |
| 2014 | $641 | $15,400 | $2,500 | $12,900 |
Source: Public Records
Map
Nearby Homes