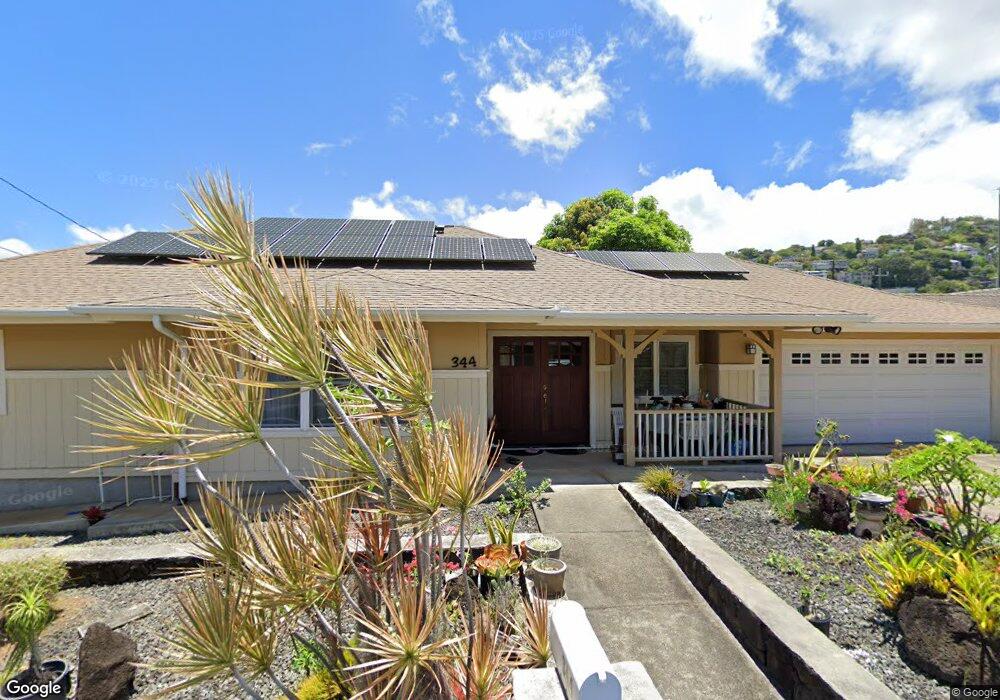
344 Kapaloala Place Unit B Honolulu, HI 96813
Nuuanu-Punchbowl NeighborhoodEstimated Value: $1,212,000 - $1,693,000
4
Beds
2
Baths
996
Sq Ft
$1,375/Sq Ft
Est. Value
About This Home
This home is located at 344 Kapaloala Place Unit B, Honolulu, HI 96813 and is currently estimated at $1,369,126, approximately $1,374 per square foot. 344 Kapaloala Place Unit B is a home located in Honolulu County with nearby schools including Pauoa Elementary School, Prince David Kawananakoa Middle School, and President Theodore Roosevelt High School.
Ownership History
Date
Name
Owned For
Owner Type
Purchase Details
Closed on
Aug 28, 2020
Sold by
Kamikawa Michel M and Michael M Kamikawa Trust
Bought by
Kamikawa Michael M
Current Estimated Value
Purchase Details
Closed on
Aug 22, 2011
Sold by
Kamikawa Michael M
Bought by
Kamikawa Michael M
Purchase Details
Closed on
Jul 14, 2010
Sold by
Kamikawa Ellen A and Kamikawa Boyd M
Bought by
Kamikawa Ellen A and Kamikawa Michael M
Purchase Details
Closed on
Jan 28, 2004
Sold by
Kamikawa Ellen A
Bought by
Kamikawa Ellen A and Michael M Kamikawa Trust
Purchase Details
Closed on
Oct 11, 2001
Sold by
Bank Of Hawaii
Bought by
Rga Corp
Create a Home Valuation Report for This Property
The Home Valuation Report is an in-depth analysis detailing your home's value as well as a comparison with similar homes in the area
Home Values in the Area
Average Home Value in this Area
Purchase History
| Date | Buyer | Sale Price | Title Company |
|---|---|---|---|
| Kamikawa Michael M | -- | None Available | |
| Kamikawa Michael M | -- | None Available | |
| Kamikawa Michael M | -- | None Available | |
| Kamikawa Michael M | -- | None Available | |
| Kamikawa Michael M | -- | None Available | |
| Kamikawa Ellen A | -- | None Available | |
| Kamikawa Ellen A | -- | -- | |
| Kamikawa Boyd M | -- | -- | |
| Kamikawa Ellen A | -- | -- | |
| Rga Corp | -- | -- |
Source: Public Records
Tax History Compared to Growth
Tax History
| Year | Tax Paid | Tax Assessment Tax Assessment Total Assessment is a certain percentage of the fair market value that is determined by local assessors to be the total taxable value of land and additions on the property. | Land | Improvement |
|---|---|---|---|---|
| 2025 | $4,088 | $1,381,800 | $1,159,700 | $222,100 |
| 2024 | $4,088 | $1,288,100 | $1,019,300 | $268,800 |
| 2023 | $3,497 | $1,199,100 | $978,500 | $220,600 |
| 2022 | $3,230 | $922,900 | $774,600 | $148,300 |
| 2021 | $2,952 | $843,400 | $733,900 | $109,500 |
| 2020 | $3,128 | $893,700 | $754,300 | $139,400 |
| 2019 | $2,736 | $781,700 | $668,500 | $113,200 |
| 2018 | $2,792 | $797,800 | $668,500 | $129,300 |
| 2017 | $2,925 | $835,600 | $560,100 | $275,500 |
| 2016 | $2,606 | $744,700 | $524,000 | $220,700 |
| 2015 | $2,447 | $699,100 | $498,700 | $200,400 |
| 2014 | $1,685 | $650,300 | $491,400 | $158,900 |
Source: Public Records
Map
Nearby Homes
- 238 Naone St
- 2122 Tantalus Dr
- 322 Auwaiolimu St
- 2153 Booth Rd
- 2138 Kanealii Ave
- 2143 Booth Rd
- 2134 Kanealii Ave
- 2578 Pacific Heights Rd
- 2571 Kekuanoni St
- 2453 Pacific Heights Rd Unit C
- 756 Iaukea St
- 21 Craigside Place Unit 8D
- 1940 Pacific Heights Rd
- 55 S Judd St Unit 803
- 55 S Judd St Unit 1901
- 55 S Judd St Unit 2206
- 55 S Judd St Unit 705
- 55 S Judd St Unit 1501
- 2101 Nuuanu Ave Unit I301
- 2101 Nuuanu Ave Unit I303
- 344 Kapaloala Place
- 350 Kapaloala Place
- 343 Kapaloala Place
- 338 Kapaloala Place
- 349 Kapaloala Place
- 331 Kapaloala Place Unit A
- 331 Kapaloala Place
- 331 Kapaloala Place Unit B
- 320 Kapaloala Place
- 334 Kapaloala Place
- 356 Kapaloala Place
- 314 Kapaloala Place
- 355 Kapaloala Place
- 2351 Pauoa Rd
- 364 Kapaloala Place
- 2345 Pauoa Rd
- 2345 Pauoa Rd Unit A
- 359 Kapaloala Place
- 2341 Pauoa Rd
- 2357 Pauoa Rd