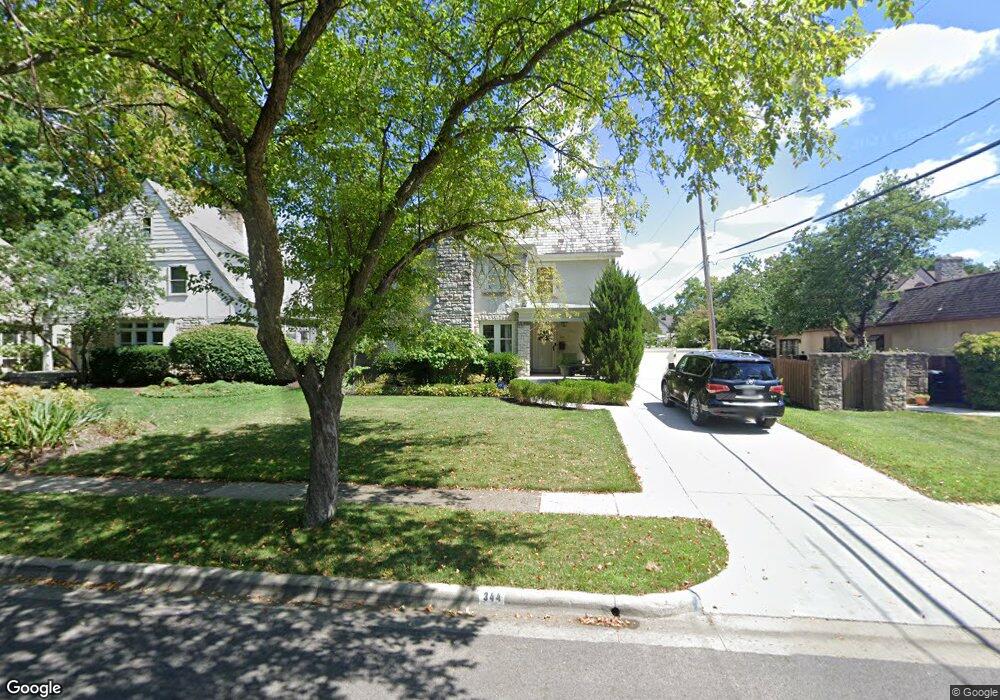
344 S Ardmore Rd Columbus, OH 43209
Estimated Value: $969,000 - $1,317,000
4
Beds
4
Baths
3,300
Sq Ft
$332/Sq Ft
Est. Value
About This Home
This home is located at 344 S Ardmore Rd, Columbus, OH 43209 and is currently estimated at $1,096,459, approximately $332 per square foot. 344 S Ardmore Rd is a home located in Franklin County with nearby schools including Cassingham Elementary School, Bexley Middle School, and Bexley High School.
Ownership History
Date
Name
Owned For
Owner Type
Purchase Details
Closed on
Jan 4, 2008
Sold by
Westin Joseph Robert and Westin Cynthia Renee
Bought by
Helvie Todd G and Helvie Kim K
Current Estimated Value
Home Financials for this Owner
Home Financials are based on the most recent Mortgage that was taken out on this home.
Original Mortgage
$417,000
Outstanding Balance
$260,324
Interest Rate
5.95%
Mortgage Type
Purchase Money Mortgage
Estimated Equity
$836,135
Purchase Details
Closed on
Aug 26, 2005
Sold by
Butts Joseph Robert and Widrig Cynthia Renee
Bought by
Westin Joseph Robert and Westin Cynthia Renee
Purchase Details
Closed on
May 23, 2003
Sold by
Pritchett Clark P
Bought by
Butts Joseph Robert and Widrig Cynthia Renee
Purchase Details
Closed on
Jul 24, 1970
Bought by
Frank John M
Create a Home Valuation Report for This Property
The Home Valuation Report is an in-depth analysis detailing your home's value as well as a comparison with similar homes in the area
Home Values in the Area
Average Home Value in this Area
Purchase History
| Date | Buyer | Sale Price | Title Company |
|---|---|---|---|
| Helvie Todd G | $655,000 | Amerititle | |
| Westin Joseph Robert | -- | Amerititle | |
| Butts Joseph Robert | $198,900 | Chicago Title | |
| Frank John M | -- | -- |
Source: Public Records
Mortgage History
| Date | Status | Borrower | Loan Amount |
|---|---|---|---|
| Open | Helvie Todd G | $417,000 |
Source: Public Records
Tax History Compared to Growth
Tax History
| Year | Tax Paid | Tax Assessment Tax Assessment Total Assessment is a certain percentage of the fair market value that is determined by local assessors to be the total taxable value of land and additions on the property. | Land | Improvement |
|---|---|---|---|---|
| 2024 | $14,051 | $253,020 | $77,600 | $175,420 |
| 2023 | $12,633 | $253,015 | $77,595 | $175,420 |
| 2022 | $16,287 | $261,980 | $53,870 | $208,110 |
| 2021 | $16,300 | $261,980 | $53,870 | $208,110 |
| 2020 | $16,156 | $261,980 | $53,870 | $208,110 |
| 2019 | $14,185 | $202,380 | $44,910 | $157,470 |
| 2018 | $12,378 | $202,380 | $44,910 | $157,470 |
| 2017 | $12,029 | $202,380 | $44,910 | $157,470 |
| 2016 | $12,394 | $190,540 | $37,870 | $152,670 |
| 2015 | $12,430 | $190,540 | $37,870 | $152,670 |
| 2014 | $12,501 | $190,540 | $37,870 | $152,670 |
| 2013 | $5,907 | $173,215 | $34,440 | $138,775 |
Source: Public Records
Map
Nearby Homes
- 268 S Cassady Ave
- 2455 Dale Ave
- 208 S Stanwood Rd
- 2425 Bryden Rd
- 2564 Sherwood Rd
- 2424 Sherwood Rd
- 2629 E Broad St
- 563 S Dawson Ave
- 2717 E Broad St
- 2731 E Broad St
- 123 S Gould Rd
- 142 S Gould Rd
- 2738 E Broad St
- 49 N Cassingham Rd
- 696 Vernon Rd
- 96 N Cassingham Rd
- 419 Westland Ave
- 782 S Remington Rd
- 57 Preston Rd
- 789 Chelsea Ave
- 334 S Ardmore Rd
- 2532 Fair Ave
- 2542 Fair Ave
- 324 S Ardmore Rd
- 2548 Fair Ave
- 345 S Cassingham Rd
- 2554 Fair Ave
- 341 S Cassingham Rd
- 320 S Ardmore Rd
- 333 S Cassingham Rd
- 2518 Fair Ave
- 339 S Ardmore Rd
- 2560 Fair Ave
- 333 S Ardmore Rd
- 312 S Ardmore Rd
- 325 S Cassingham Rd
- 325 S Ardmore Rd
- 315 S Ardmore Rd
- 319 S Cassingham Rd
- 2498 Fair Ave