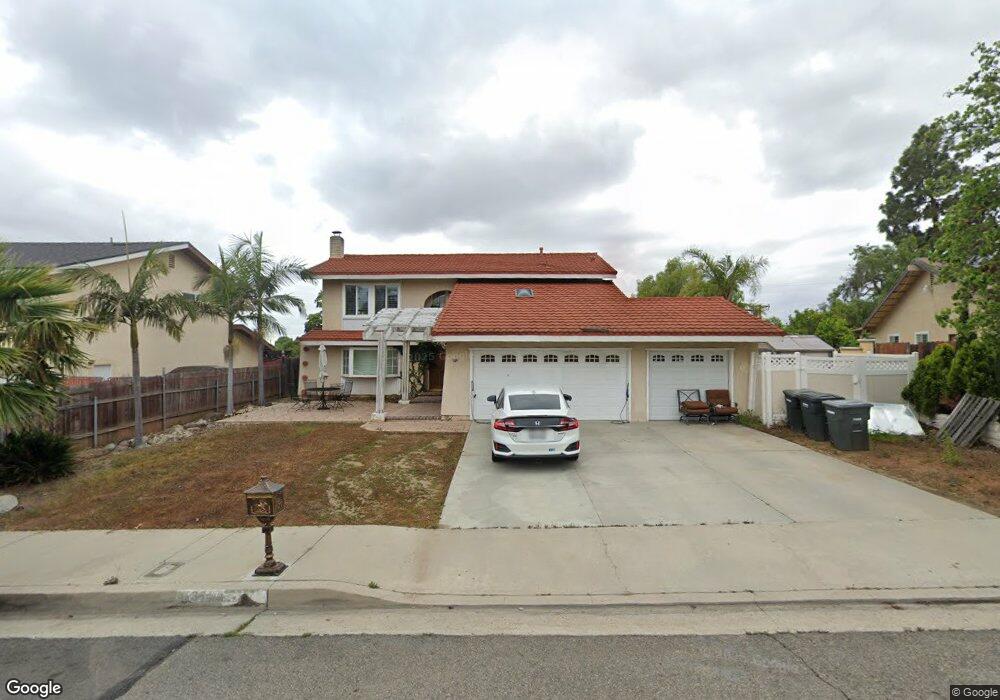
344 S Nutwood St Orange, CA 92869
Estimated Value: $1,214,706 - $1,347,000
4
Beds
3
Baths
2,028
Sq Ft
$620/Sq Ft
Est. Value
About This Home
This home is located at 344 S Nutwood St, Orange, CA 92869 and is currently estimated at $1,256,677, approximately $619 per square foot. 344 S Nutwood St is a home located in Orange County with nearby schools including Jordan Academy of Language & Computer Science, El Modena High School, and Orange County Classical Academy.
Ownership History
Date
Name
Owned For
Owner Type
Purchase Details
Closed on
Jul 21, 2021
Sold by
Nguyen Mylinh
Bought by
Nguyen Bryan
Current Estimated Value
Purchase Details
Closed on
Aug 2, 2016
Sold by
Nguyen Bryan and Nguyen Mylinh
Bought by
Nguyen Bryan and Nguyen Mylinh
Home Financials for this Owner
Home Financials are based on the most recent Mortgage that was taken out on this home.
Original Mortgage
$415,000
Outstanding Balance
$259,900
Interest Rate
3.48%
Mortgage Type
New Conventional
Estimated Equity
$996,777
Purchase Details
Closed on
Apr 20, 2010
Sold by
Kennedy Ellen
Bought by
Nguyen Bryan and Nguyen Mylinh
Home Financials for this Owner
Home Financials are based on the most recent Mortgage that was taken out on this home.
Original Mortgage
$376,000
Interest Rate
5.03%
Mortgage Type
New Conventional
Purchase Details
Closed on
Sep 18, 2007
Sold by
Niedbala Arthur
Bought by
Niedbala Arthur George and Arthur George Niedbala Revocable Trust
Create a Home Valuation Report for This Property
The Home Valuation Report is an in-depth analysis detailing your home's value as well as a comparison with similar homes in the area
Home Values in the Area
Average Home Value in this Area
Purchase History
| Date | Buyer | Sale Price | Title Company |
|---|---|---|---|
| Nguyen Bryan | -- | None Available | |
| Nguyen Bryan | -- | Fidelity National Title | |
| Nguyen Bryan | $470,000 | Investors Title Company | |
| Niedbala Arthur George | -- | None Available |
Source: Public Records
Mortgage History
| Date | Status | Borrower | Loan Amount |
|---|---|---|---|
| Open | Nguyen Bryan | $415,000 | |
| Closed | Nguyen Bryan | $376,000 |
Source: Public Records
Tax History Compared to Growth
Tax History
| Year | Tax Paid | Tax Assessment Tax Assessment Total Assessment is a certain percentage of the fair market value that is determined by local assessors to be the total taxable value of land and additions on the property. | Land | Improvement |
|---|---|---|---|---|
| 2025 | $6,607 | $606,680 | $403,299 | $203,381 |
| 2024 | $6,607 | $594,785 | $395,391 | $199,394 |
| 2023 | $6,459 | $583,123 | $387,638 | $195,485 |
| 2022 | $6,333 | $571,690 | $380,038 | $191,652 |
| 2021 | $6,155 | $560,481 | $372,586 | $187,895 |
| 2020 | $6,098 | $554,734 | $368,765 | $185,969 |
| 2019 | $6,020 | $543,857 | $361,534 | $182,323 |
| 2018 | $5,927 | $533,194 | $354,445 | $178,749 |
| 2017 | $5,681 | $522,740 | $347,495 | $175,245 |
| 2016 | $5,570 | $512,491 | $340,682 | $171,809 |
| 2015 | $5,488 | $504,793 | $335,564 | $169,229 |
| 2014 | $5,370 | $494,905 | $328,990 | $165,915 |
Source: Public Records
Map
Nearby Homes
- 285 S James St
- 411 S Hewes St
- 672 S Schug St
- 429 S Hill St
- 12302 Circula Panorama
- 4705 E Washington Ave
- 12306 Circula Panorama
- 18936 1/2 E Smiley Dr
- 12308 Circula Panorama
- 12273 Baja Panorama
- 12272 Media Panorama
- 4900 E Chapman Ave Unit 24
- 4900 E Chapman Ave Unit 62
- 4900 E Chapman Ave Unit 4
- 19002 E Smiley Dr
- 3801 E Spring St
- 18831 Winnwood Ln
- 129 S Kathleen Ln
- 310 N Swidler St
- 3932 E Sycamore Ave
- 354 S Nutwood St
- 3943 E Donna Ave
- 3915 E Roberta Dr
- 362 S Nutwood St
- 4008 E Donna Ave
- 4007 E Donna Ave
- 3910 E Roberta Dr
- 3911 E Roberta Dr
- 3940 E Palmyra Ave
- 3920 E Palmyra Ave
- 352 S Heatherstone St
- 330 S Heatherstone St
- 372 S Nutwood St
- 367 S Nutwood St
- 3910 E Palmyra Ave
- 4002 E Palmyra Ave
- 3844 E Roberta Dr
- 364 S Heatherstone St
- 320 S Heatherstone St
- 3911 E Dorothy Dr