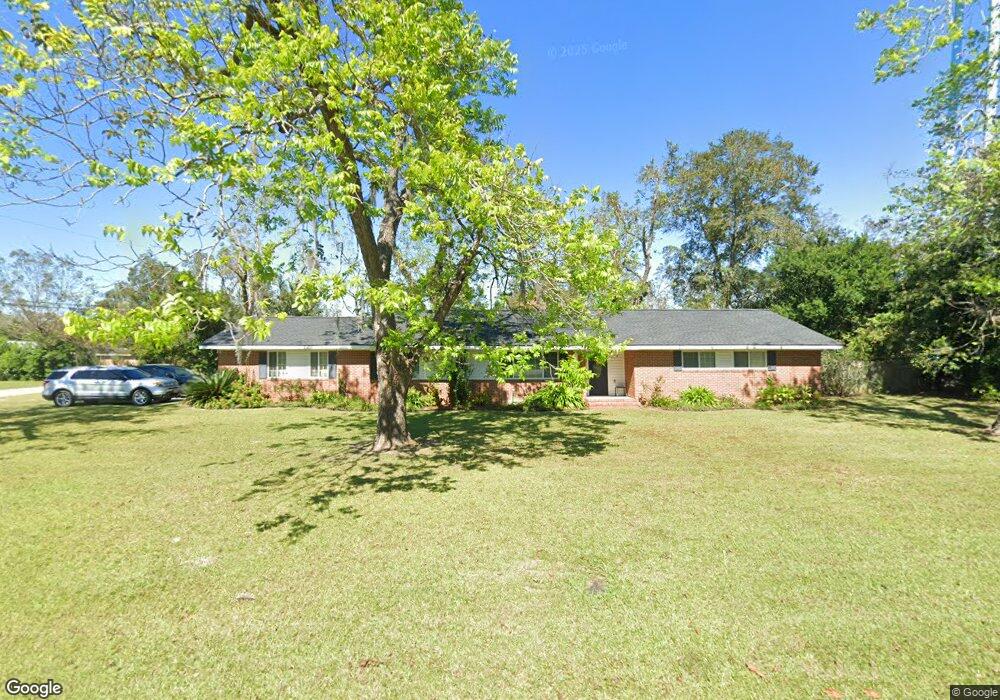
344 W Carter Ave Blackshear, GA 31516
Estimated Value: $194,000 - $260,000
3
Beds
2
Baths
2,580
Sq Ft
$86/Sq Ft
Est. Value
About This Home
This home is located at 344 W Carter Ave, Blackshear, GA 31516 and is currently estimated at $222,792, approximately $86 per square foot. 344 W Carter Ave is a home located in Pierce County with nearby schools including Pierce County High School, Southeast Christian Academy, and Truth Christian Academy.
Ownership History
Date
Name
Owned For
Owner Type
Purchase Details
Closed on
Apr 18, 2007
Sold by
Hsbc Mtg Svcs Inc
Bought by
Neubauer Patricia
Current Estimated Value
Purchase Details
Closed on
Aug 1, 2006
Sold by
Parr Jeffrey Wright
Bought by
Hsbc Mtg Svcs Inc
Purchase Details
Closed on
Jun 29, 2006
Sold by
Parr Jeffrey
Bought by
Wells Fargo Bank
Purchase Details
Closed on
Nov 12, 2004
Sold by
Parrish Ralph
Bought by
Parr Jeffrey Wright
Purchase Details
Closed on
Aug 13, 1999
Sold by
Parrish Ralph
Bought by
Parr Jeffrey Wright
Purchase Details
Closed on
Jan 14, 1985
Bought by
Parrish Ralph
Purchase Details
Closed on
Jun 5, 1984
Bought by
United Fed Sav & Loan
Purchase Details
Closed on
Mar 30, 1978
Sold by
Davis Clara
Bought by
Williams James and Williams Dorothy
Create a Home Valuation Report for This Property
The Home Valuation Report is an in-depth analysis detailing your home's value as well as a comparison with similar homes in the area
Home Values in the Area
Average Home Value in this Area
Purchase History
| Date | Buyer | Sale Price | Title Company |
|---|---|---|---|
| Neubauer Patricia | $53,600 | -- | |
| Hsbc Mtg Svcs Inc | $78,660 | -- | |
| Wells Fargo Bank | $125,976 | -- | |
| Parr Jeffrey Wright | -- | -- | |
| Parr Jeffrey Wright | $62,000 | -- | |
| Parrish Ralph | -- | -- | |
| United Fed Sav & Loan | -- | -- | |
| Williams James | -- | -- |
Source: Public Records
Tax History Compared to Growth
Tax History
| Year | Tax Paid | Tax Assessment Tax Assessment Total Assessment is a certain percentage of the fair market value that is determined by local assessors to be the total taxable value of land and additions on the property. | Land | Improvement |
|---|---|---|---|---|
| 2025 | $2,364 | $80,022 | $2,640 | $77,382 |
| 2024 | $2,364 | $73,723 | $2,640 | $71,083 |
| 2023 | $2,364 | $73,723 | $2,640 | $71,083 |
| 2022 | $1,607 | $42,305 | $5,468 | $36,837 |
| 2021 | $1,666 | $40,744 | $5,468 | $35,276 |
| 2020 | $1,623 | $39,184 | $5,468 | $33,716 |
| 2019 | $1,623 | $39,184 | $5,468 | $33,716 |
| 2018 | $1,562 | $37,622 | $5,468 | $32,154 |
| 2017 | $1,528 | $36,686 | $5,468 | $31,218 |
| 2016 | $1,524 | $36,686 | $5,468 | $31,218 |
| 2015 | $1,313 | $36,686 | $5,468 | $31,218 |
| 2014 | $1,313 | $36,686 | $5,468 | $31,218 |
| 2013 | $1,313 | $36,686 | $5,468 | $31,218 |
Source: Public Records
Map
Nearby Homes
- 515 Grady St
- 322 Mcgregor St
- 3551 Cason Rd
- 420 Jackson St
- 810 Jackson St
- 331 Central Ave W
- 3360 Strickland Avenue Extension
- 3344 Strickland Ave
- 0001 Georgia 121
- ST. ROUTE 121 Georgia 121
- 706 Jenkins St
- 121 Beaver Dr
- 862 Watson St
- 622 E Main St
- 2936 Piney Grove Cir
- 1157 Tanner Cir
- 131 Fawn Ln
- 830 Jane St
- 101 Fawn Ln
- 915 Jane St