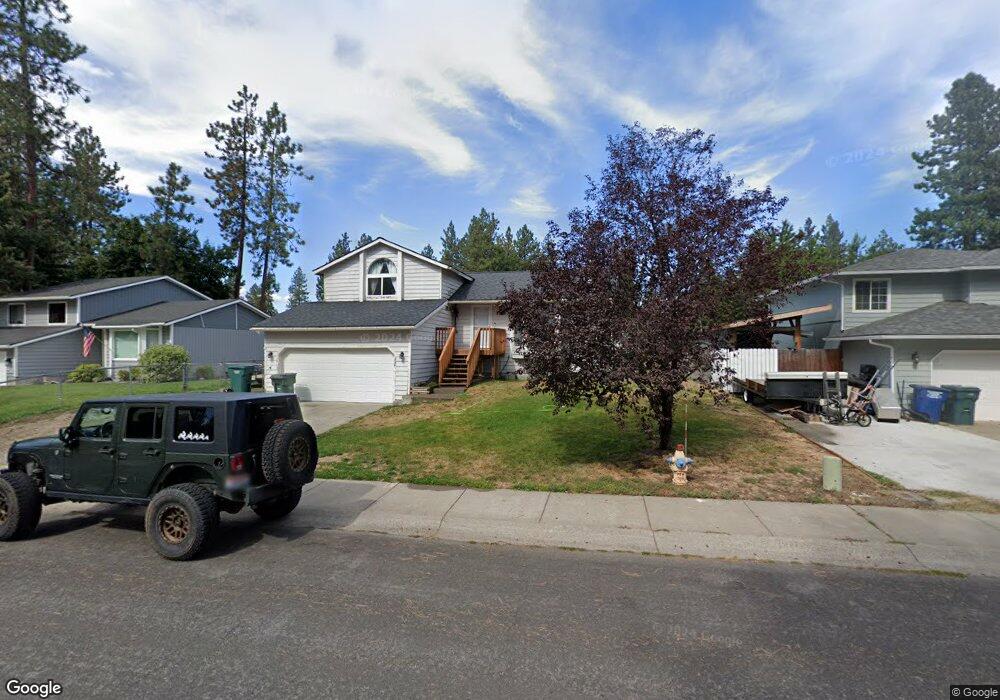
3441 E Mountain View Dr Post Falls, ID 83854
Milltown NeighborhoodEstimated Value: $463,343 - $504,000
3
Beds
2
Baths
1,472
Sq Ft
$330/Sq Ft
Est. Value
About This Home
This home is located at 3441 E Mountain View Dr, Post Falls, ID 83854 and is currently estimated at $485,336, approximately $329 per square foot. 3441 E Mountain View Dr is a home located in Kootenai County with nearby schools including Ponderosa Elementary School, Post Falls Middle School, and Post Falls High School.
Ownership History
Date
Name
Owned For
Owner Type
Purchase Details
Closed on
Dec 23, 2021
Sold by
Eddings Erin J
Bought by
Eddings Erin J and Olson Jessy
Current Estimated Value
Home Financials for this Owner
Home Financials are based on the most recent Mortgage that was taken out on this home.
Original Mortgage
$225,000
Outstanding Balance
$206,941
Interest Rate
3.11%
Mortgage Type
New Conventional
Estimated Equity
$278,395
Purchase Details
Closed on
Jun 29, 2015
Sold by
Jpmorgan Chase Bank N A
Bought by
The Secretary Of H U D
Purchase Details
Closed on
Aug 25, 2014
Sold by
Stoven Craig E and Stoven Tina R
Bought by
Jpmorgan Chase Bank Na
Purchase Details
Closed on
May 29, 2008
Sold by
Alleman Brandon C and Alleman Carolyn D
Bought by
Stovern Craig E and Stovern Tina R
Home Financials for this Owner
Home Financials are based on the most recent Mortgage that was taken out on this home.
Original Mortgage
$193,562
Interest Rate
5.87%
Mortgage Type
FHA
Create a Home Valuation Report for This Property
The Home Valuation Report is an in-depth analysis detailing your home's value as well as a comparison with similar homes in the area
Home Values in the Area
Average Home Value in this Area
Purchase History
| Date | Buyer | Sale Price | Title Company |
|---|---|---|---|
| Eddings Erin J | -- | First American Ttl Kootenai | |
| The Secretary Of H U D | -- | Pioneer Title Kootenai Count | |
| Jpmorgan Chase Bank Na | $139,620 | None Available | |
| Stovern Craig E | -- | -- |
Source: Public Records
Mortgage History
| Date | Status | Borrower | Loan Amount |
|---|---|---|---|
| Open | Eddings Erin J | $225,000 | |
| Previous Owner | Stovern Craig E | $193,562 |
Source: Public Records
Tax History
| Year | Tax Paid | Tax Assessment Tax Assessment Total Assessment is a certain percentage of the fair market value that is determined by local assessors to be the total taxable value of land and additions on the property. | Land | Improvement |
|---|---|---|---|---|
| 2025 | $1,591 | $416,920 | $162,500 | $254,420 |
| 2024 | $1,474 | $385,370 | $130,000 | $255,370 |
| 2023 | $1,474 | $406,417 | $153,600 | $252,817 |
| 2022 | $2,163 | $472,907 | $192,000 | $280,907 |
| 2021 | $1,894 | $309,470 | $120,000 | $189,470 |
| 2020 | $1,814 | $256,170 | $90,000 | $166,170 |
| 2019 | $1,752 | $235,870 | $80,000 | $155,870 |
| 2018 | $1,434 | $199,120 | $75,000 | $124,120 |
| 2017 | $1,401 | $178,170 | $55,000 | $123,170 |
| 2016 | $1,365 | $163,930 | $45,000 | $118,930 |
| 2015 | $1,344 | $165,190 | $45,000 | $120,190 |
| 2013 | $2,464 | $139,780 | $38,000 | $101,780 |
Source: Public Records
Map
Nearby Homes
- 112 N Cambie St
- 0 N Spencer St
- 352 N Promenade Loop Unit 103
- 4764 E Seltice Way
- 1949 E Plaza Ct
- NKA S Mossy Rock Ln
- 308 N Greensferry Rd Unit 109
- 1903 E Strand Ave
- 1048 E 4th Ave
- 1048 E 4th Ave Unit 104
- 1710 E 1st Ave
- NNA E Mullan Ave
- XXX E 3rd Ave
- 3683 E Mullan Ave
- 1611 E Plaza Dr
- 8817 W Riverview Dr
- L1B1 N Post Falls Dr
- 3270 E Quad Park Ct
- 926 N Goldenrod Ct
- 1609 E Park Ln
- 3465 E Mountain View Dr
- 3421 E Mountain View Dr
- 550 Mountain View Rd N
- 323 E Mountain View Dr
- 316 E Mountain View Dr
- 2902 E Mountain View Dr
- 2910 E Mountain View Dr
- 122 S Dart St
- 126 S Dart St
- 120 S Dart St
- 3485 E Mountain View Dr
- 3397 E Mountain View Dr
- 128 S Dart St
- 2909 Dart St
- 2901 Dart St
- 3509 E Mountain View Dr
- 118 S Dart St
- 2905 Dart St
- 3369 E Mountain View Dr
- 130 S Dart St
Your Personal Tour Guide
Ask me questions while you tour the home.