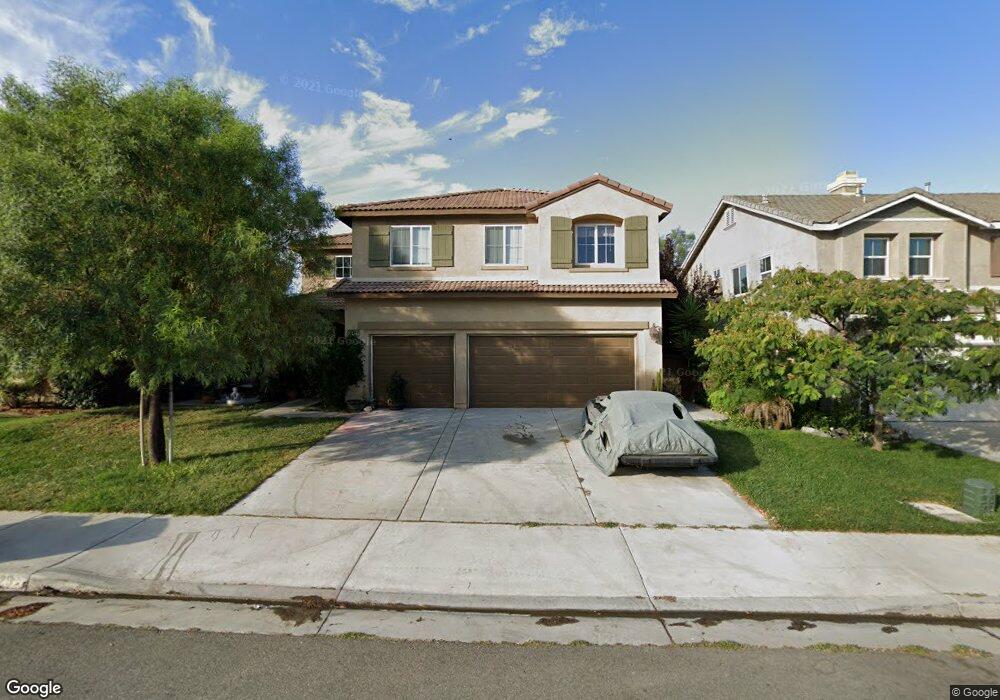
34429 Crenshaw St Beaumont, CA 92223
Fairway Canyon NeighborhoodEstimated Value: $537,000 - $628,000
5
Beds
3
Baths
3,252
Sq Ft
$181/Sq Ft
Est. Value
About This Home
This home is located at 34429 Crenshaw St, Beaumont, CA 92223 and is currently estimated at $588,543, approximately $180 per square foot. 34429 Crenshaw St is a home located in Riverside County with nearby schools including Summerwind Trails and Beaumont Senior High School.
Ownership History
Date
Name
Owned For
Owner Type
Purchase Details
Closed on
Nov 22, 2020
Sold by
Luna Xavier and Vargas Josefina
Bought by
Luna Xavier
Current Estimated Value
Purchase Details
Closed on
Feb 8, 2016
Sold by
Vargas Federico
Bought by
Luna Xavier and Vargas Josefina
Purchase Details
Closed on
Jan 17, 2014
Sold by
Luna Jacqueline
Bought by
Luna Xavier and Vargas Josefina
Purchase Details
Closed on
Jun 19, 2008
Sold by
Vargas Federico and Vargas Josefina
Bought by
Luna Jacqueline
Purchase Details
Closed on
Apr 5, 2008
Sold by
Lennar Homes Of California Inc
Bought by
Vargas Federico and Vargas Josefina
Home Financials for this Owner
Home Financials are based on the most recent Mortgage that was taken out on this home.
Original Mortgage
$320,943
Outstanding Balance
$201,602
Interest Rate
5.81%
Mortgage Type
FHA
Estimated Equity
$386,941
Create a Home Valuation Report for This Property
The Home Valuation Report is an in-depth analysis detailing your home's value as well as a comparison with similar homes in the area
Home Values in the Area
Average Home Value in this Area
Purchase History
| Date | Buyer | Sale Price | Title Company |
|---|---|---|---|
| Luna Xavier | -- | None Available | |
| Luna Xavier | -- | None Available | |
| Luna Xavier | -- | None Available | |
| Luna Jacqueline | -- | None Available | |
| Vargas Federico | $326,000 | North American Title Company |
Source: Public Records
Mortgage History
| Date | Status | Borrower | Loan Amount |
|---|---|---|---|
| Open | Vargas Federico | $320,943 |
Source: Public Records
Tax History
| Year | Tax Paid | Tax Assessment Tax Assessment Total Assessment is a certain percentage of the fair market value that is determined by local assessors to be the total taxable value of land and additions on the property. | Land | Improvement |
|---|---|---|---|---|
| 2025 | $9,845 | $418,409 | $72,126 | $346,283 |
| 2023 | $9,845 | $402,164 | $69,326 | $332,838 |
| 2022 | $9,675 | $394,279 | $67,967 | $326,312 |
| 2021 | $9,372 | $386,549 | $66,635 | $319,914 |
| 2020 | $8,603 | $329,687 | $82,418 | $247,269 |
| 2019 | $8,866 | $323,223 | $80,802 | $242,421 |
| 2018 | $8,363 | $316,886 | $79,218 | $237,668 |
| 2017 | $8,825 | $310,673 | $77,665 | $233,008 |
| 2016 | $9,373 | $304,583 | $76,143 | $228,440 |
| 2015 | $9,194 | $300,009 | $75,000 | $225,009 |
| 2014 | $8,541 | $255,000 | $64,000 | $191,000 |
Source: Public Records
Map
Nearby Homes
- 34170 Ogrady Ct
- 34596 Venturi Ave
- 34641 Irwin St
- 11486 Floyd Cir
- 11484 Armour Ave
- 35021 Nicklaus Nook
- 1512 Yucca Ct
- 1500 Yucca Ct
- 1537 Yucca Ct
- 11421 Faldo St
- 11511 Ballesteros Dr
- 11416 Faldo St
- 11503 Ballesteros Dr
- 11411 Faldo St
- 11407 Faldo St
- 35060 Ouimet Way
- 1099 Little Leaf St
- 35080 Ouimet Way
- 11449 Lyle Ln
- 35084 Ouimet Way
- 34415 Crenshaw St
- 34441 Crenshaw St
- 34463 Crenshaw St
- 34436 Crenshaw St
- 34420 Crenshaw St
- 34454 Crenshaw St
- 34377 Crenshaw St
- 34475 Crenshaw St
- 34396 Crenshaw St
- 34468 Crenshaw St
- 34378 Crenshaw St
- 34359 Crenshaw St
- 34487 Crenshaw St
- 34482 Crenshaw St
- 34360 Crenshaw St
- 34343 Crenshaw St
- 34490 Crenshaw St
- 34495 Crenshaw St
- 34344 Crenshaw St
- 34327 Crenshaw St
Your Personal Tour Guide
Ask me questions while you tour the home.