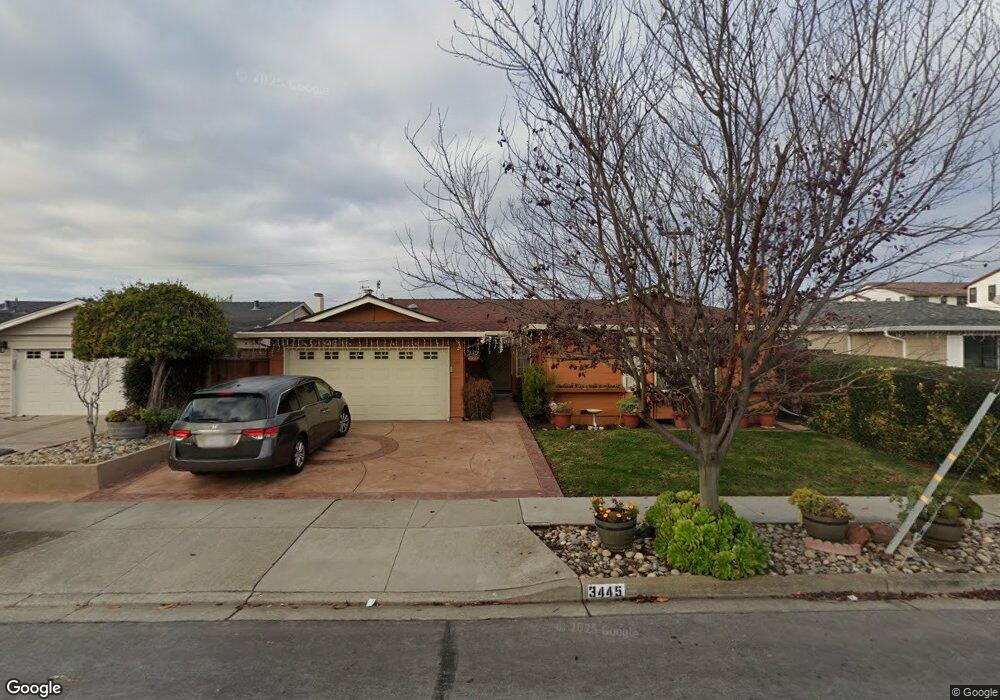
3445 Sutton Loop Fremont, CA 94536
Centerville District NeighborhoodEstimated Value: $1,644,452 - $1,877,000
3
Beds
2
Baths
1,966
Sq Ft
$899/Sq Ft
Est. Value
About This Home
This home is located at 3445 Sutton Loop, Fremont, CA 94536 and is currently estimated at $1,766,613, approximately $898 per square foot. 3445 Sutton Loop is a home located in Alameda County with nearby schools including Parkmont Elementary School, Centerville Junior High School, and Washington High School.
Ownership History
Date
Name
Owned For
Owner Type
Purchase Details
Closed on
Oct 26, 2012
Sold by
Ramachandran Divya
Bought by
Ramakrishna Amarnath B
Current Estimated Value
Home Financials for this Owner
Home Financials are based on the most recent Mortgage that was taken out on this home.
Original Mortgage
$403,000
Outstanding Balance
$279,007
Interest Rate
3.43%
Mortgage Type
New Conventional
Estimated Equity
$1,487,606
Purchase Details
Closed on
Aug 13, 2010
Sold by
Gibson Stephen L and Gibson Christine M
Bought by
Ramakrishna Amarnath B and Ramachandran Divya
Home Financials for this Owner
Home Financials are based on the most recent Mortgage that was taken out on this home.
Original Mortgage
$415,000
Interest Rate
4.51%
Mortgage Type
New Conventional
Purchase Details
Closed on
Oct 27, 2006
Sold by
Gibson Stephen L and Gibson Christine M
Bought by
Gibson Stephen L and Gibson Christine M
Create a Home Valuation Report for This Property
The Home Valuation Report is an in-depth analysis detailing your home's value as well as a comparison with similar homes in the area
Home Values in the Area
Average Home Value in this Area
Purchase History
| Date | Buyer | Sale Price | Title Company |
|---|---|---|---|
| Ramakrishna Amarnath B | -- | Fidelity National Title Co | |
| Ramakrishna Amarnath B | $568,000 | First American Title Company | |
| Gibson Stephen L | -- | None Available |
Source: Public Records
Mortgage History
| Date | Status | Borrower | Loan Amount |
|---|---|---|---|
| Open | Ramakrishna Amarnath B | $403,000 | |
| Closed | Ramakrishna Amarnath B | $415,000 |
Source: Public Records
Tax History
| Year | Tax Paid | Tax Assessment Tax Assessment Total Assessment is a certain percentage of the fair market value that is determined by local assessors to be the total taxable value of land and additions on the property. | Land | Improvement |
|---|---|---|---|---|
| 2025 | $8,822 | $720,536 | $218,171 | $509,365 |
| 2024 | $8,822 | $706,276 | $213,895 | $499,381 |
| 2023 | $8,581 | $699,294 | $209,702 | $489,592 |
| 2022 | $8,465 | $678,585 | $205,591 | $479,994 |
| 2021 | $8,258 | $665,143 | $201,560 | $470,583 |
| 2020 | $8,265 | $665,254 | $199,494 | $465,760 |
| 2019 | $8,171 | $652,215 | $195,584 | $456,631 |
| 2018 | $8,010 | $639,431 | $191,750 | $447,681 |
| 2017 | $7,810 | $626,898 | $187,992 | $438,906 |
| 2016 | $7,674 | $614,609 | $184,307 | $430,302 |
| 2015 | $7,569 | $605,380 | $181,539 | $423,841 |
| 2014 | $7,437 | $593,522 | $177,983 | $415,539 |
Source: Public Records
Map
Nearby Homes
- 3554 Shadowbrook Terrace
- 37470 Parish Cir Unit 19C
- 3046 Greenwood Dr
- 3291 Foxtail Terrace
- 3623 Sutton Loop
- 3232 Red Cedar Terrace Unit LU15
- 37311 Aspenwood Common Unit 203
- 3550 Buttonwood Terrace Unit 111
- 3685 Nutwood Terrace Unit 313
- 37445 Currant Terrace
- 37429 Fremont Blvd
- 37856 Bright Common
- 37434 Hazel Terrace
- 3665 Oxford Common
- 37168 Meadowbrook Common Unit 304
- 3810 Burton Common
- 3833 Burton Common
- 3041 Christine Ct
- 3402 Pinewood Terrace Unit 211
- 3674 Oakwood Terrace Unit 302
- 3459 Sutton Loop
- 3417 Sutton Loop
- 3473 Sutton Loop
- 3403 Sutton Loop
- 3397 Worthing Ct
- 3398 Sutton Loop
- 3487 Sutton Loop
- 3399 Sutton Loop
- 3385 Worthing Ct
- 3396 Worthing Ct
- 3386 Sutton Loop
- 37504 Zephyr Terrace
- 3505 Sutton Loop
- 3388 Worthing Ct
- 3377 Worthing Ct
- 37520 Chauntry Common
- 37524 Chauntry Common
- 3389 Sutton Loop
- 3374 Sutton Loop
- 37528 Chauntry Common
Your Personal Tour Guide
Ask me questions while you tour the home.