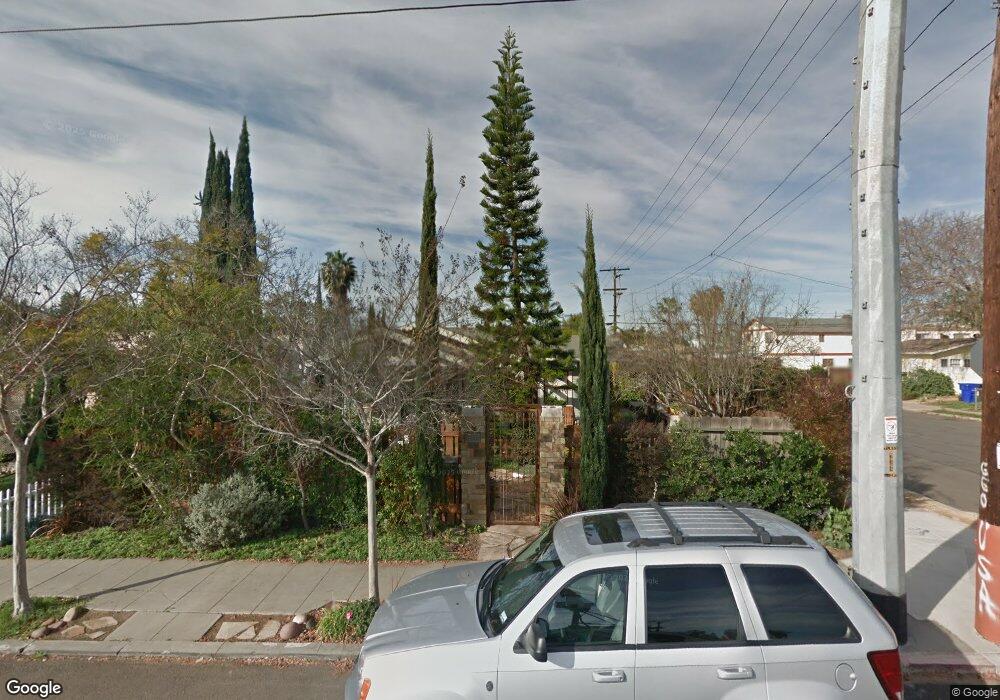
3446 32nd St San Diego, CA 92104
North Park NeighborhoodEstimated Value: $961,438 - $1,184,000
3
Beds
1
Bath
1,078
Sq Ft
$995/Sq Ft
Est. Value
About This Home
This home is located at 3446 32nd St, San Diego, CA 92104 and is currently estimated at $1,072,110, approximately $994 per square foot. 3446 32nd St is a home located in San Diego County with nearby schools including McKinley Elementary School, Roosevelt International Middle School, and St. Patrick's School.
Ownership History
Date
Name
Owned For
Owner Type
Purchase Details
Closed on
Jan 9, 2013
Sold by
Ambrose Michael and Fraser Mark
Bought by
Ambrose Michael and Fraser Mark
Current Estimated Value
Purchase Details
Closed on
Aug 31, 1995
Sold by
Walker Roger K and Baca Jo Ellen
Bought by
Gwinn Alan W and Gwinn Kristin M
Home Financials for this Owner
Home Financials are based on the most recent Mortgage that was taken out on this home.
Original Mortgage
$108,896
Interest Rate
7.88%
Mortgage Type
FHA
Purchase Details
Closed on
Aug 1, 1995
Sold by
Champion Michael
Bought by
Champion Alexandra Upham
Home Financials for this Owner
Home Financials are based on the most recent Mortgage that was taken out on this home.
Original Mortgage
$108,896
Interest Rate
7.88%
Mortgage Type
FHA
Purchase Details
Closed on
Sep 9, 1994
Sold by
Walker Robert L and Walker Josephine W
Bought by
Walker Robert L and Walker Josephine W
Create a Home Valuation Report for This Property
The Home Valuation Report is an in-depth analysis detailing your home's value as well as a comparison with similar homes in the area
Home Values in the Area
Average Home Value in this Area
Purchase History
| Date | Buyer | Sale Price | Title Company |
|---|---|---|---|
| Ambrose Michael | -- | None Available | |
| Gwinn Alan W | $109,500 | Stewart Title Company | |
| Champion Alexandra Upham | -- | Stewart Title Company | |
| Walker Robert L | -- | -- |
Source: Public Records
Mortgage History
| Date | Status | Borrower | Loan Amount |
|---|---|---|---|
| Closed | Gwinn Alan W | $108,896 |
Source: Public Records
Tax History
| Year | Tax Paid | Tax Assessment Tax Assessment Total Assessment is a certain percentage of the fair market value that is determined by local assessors to be the total taxable value of land and additions on the property. | Land | Improvement |
|---|---|---|---|---|
| 2025 | $2,793 | $233,561 | $148,739 | $84,822 |
| 2024 | $2,793 | $228,982 | $145,823 | $83,159 |
| 2023 | $2,729 | $224,493 | $142,964 | $81,529 |
| 2022 | $2,653 | $220,092 | $140,161 | $79,931 |
| 2021 | $2,632 | $215,777 | $137,413 | $78,364 |
| 2020 | $2,599 | $213,565 | $136,004 | $77,561 |
| 2019 | $2,552 | $209,379 | $133,338 | $76,041 |
| 2018 | $2,386 | $205,274 | $130,724 | $74,550 |
| 2017 | $2,328 | $201,250 | $128,161 | $73,089 |
| 2016 | $2,288 | $197,305 | $125,649 | $71,656 |
| 2015 | $2,253 | $194,342 | $123,762 | $70,580 |
| 2014 | $2,217 | $190,536 | $121,338 | $69,198 |
Source: Public Records
Map
Nearby Homes
- 3576 Herman Ave
- 3224 Upas St
- 3116 Dwight St
- 3167 Landis St
- 3736 3738 Louisiana St St
- 0 35th St
- 4010 4016 Illinois St
- 3545 Boundary St
- 3376 30th St
- 3780 32nd St
- 3385 Dwight St
- 3354-56 30th St
- 3767 Grim Ave Unit 1
- 3143 30th St Unit 47
- 3751 Ray St
- 3322 Nile St
- 3455 Landis St
- 3421 Vancouver Ave
- 2920 Bancroft St
- 3939 Illinois St Unit 4D
- 3436 32nd St
- 3175 Myrtle Ave
- 3428 32nd St
- 3502 32nd St
- 3167 Myrtle Ave
- 3172 Myrtle Ave
- 3433 Herman Ave Unit 35
- 3445 32nd St
- 3420 32nd St Unit 22
- 3439 32nd St
- 3429 32nd St Unit 31
- 3514 32nd St
- 3445 Herman Ave
- 3427 Herman Ave
- 3501 Herman Ave Unit 5
- 3431 32nd St
- 3509-11 32nd St
- 3509 32nd St Unit 11
- 3412 32nd St Unit C
- 3412 32nd St Unit D
Your Personal Tour Guide
Ask me questions while you tour the home.