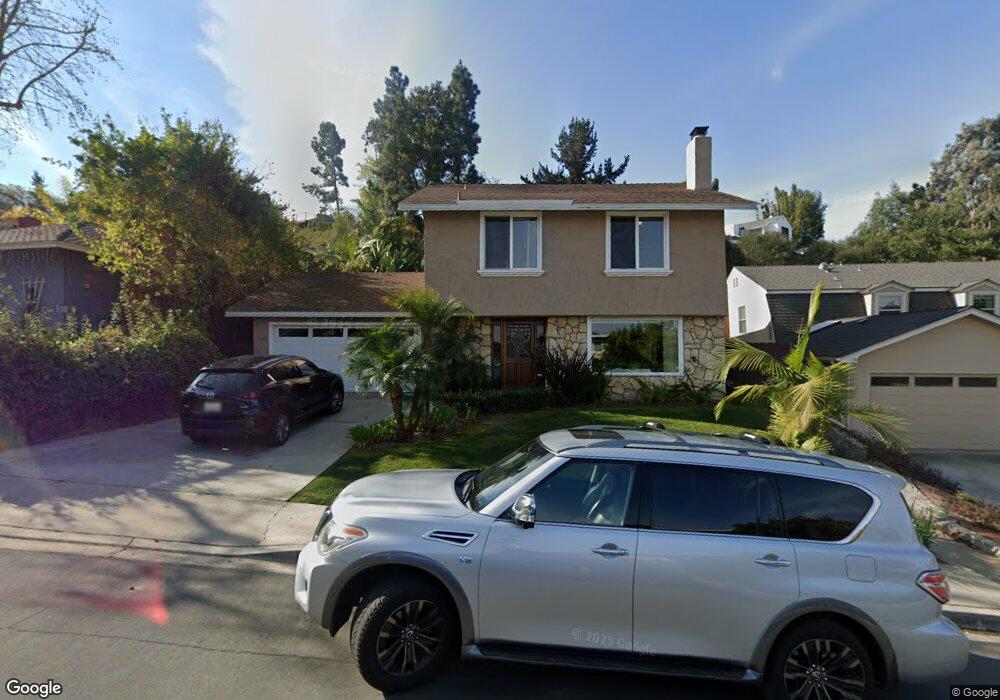
3446 Tony Dr San Diego, CA 92122
University City NeighborhoodEstimated Value: $1,518,000 - $1,865,000
4
Beds
3
Baths
2,478
Sq Ft
$685/Sq Ft
Est. Value
About This Home
This home is located at 3446 Tony Dr, San Diego, CA 92122 and is currently estimated at $1,698,540, approximately $685 per square foot. 3446 Tony Dr is a home located in San Diego County with nearby schools including Spreckels Elementary School, Standley Middle School, and University City High School.
Ownership History
Date
Name
Owned For
Owner Type
Purchase Details
Closed on
Apr 7, 2022
Sold by
Coronel Zegarra Javier L and Coro Lilian
Bought by
Coronel Family Trust
Current Estimated Value
Purchase Details
Closed on
Mar 28, 2002
Sold by
Ferrari James and Ferrari Elizabeth
Bought by
Coronel Zegarra Javier and Coronel Zegara Lilian M
Home Financials for this Owner
Home Financials are based on the most recent Mortgage that was taken out on this home.
Original Mortgage
$372,000
Interest Rate
6.87%
Purchase Details
Closed on
Feb 17, 1998
Sold by
James Ferrari
Bought by
Ferrari James and Ferrari Elizabeth
Home Financials for this Owner
Home Financials are based on the most recent Mortgage that was taken out on this home.
Original Mortgage
$166,000
Interest Rate
6.9%
Purchase Details
Closed on
Aug 5, 1991
Purchase Details
Closed on
Apr 2, 1986
Create a Home Valuation Report for This Property
The Home Valuation Report is an in-depth analysis detailing your home's value as well as a comparison with similar homes in the area
Home Values in the Area
Average Home Value in this Area
Purchase History
| Date | Buyer | Sale Price | Title Company |
|---|---|---|---|
| Coronel Family Trust | -- | None Listed On Document | |
| Zegarra Javier L Coronel | -- | None Listed On Document | |
| Coronel Zegarra Javier | $465,000 | Southland Title Company | |
| Ferrari James | -- | Chicago Title Co | |
| -- | $279,000 | -- | |
| -- | $145,000 | -- |
Source: Public Records
Mortgage History
| Date | Status | Borrower | Loan Amount |
|---|---|---|---|
| Previous Owner | Coronel Zegarra Javier | $372,000 | |
| Previous Owner | Ferrari James | $166,000 |
Source: Public Records
Tax History Compared to Growth
Tax History
| Year | Tax Paid | Tax Assessment Tax Assessment Total Assessment is a certain percentage of the fair market value that is determined by local assessors to be the total taxable value of land and additions on the property. | Land | Improvement |
|---|---|---|---|---|
| 2025 | $9,914 | $820,543 | $398,861 | $421,682 |
| 2024 | $9,914 | $804,455 | $391,041 | $413,414 |
| 2023 | $9,696 | $788,682 | $383,374 | $405,308 |
| 2022 | $9,353 | $758,058 | $368,488 | $389,570 |
| 2021 | $9,287 | $758,058 | $368,488 | $389,570 |
| 2020 | $9,174 | $750,286 | $364,710 | $385,576 |
| 2019 | $9,009 | $735,575 | $357,559 | $378,016 |
| 2018 | $8,421 | $721,153 | $350,549 | $370,604 |
| 2017 | $8,219 | $707,014 | $343,676 | $363,338 |
| 2016 | $8,087 | $693,152 | $336,938 | $356,214 |
| 2015 | $7,967 | $682,741 | $331,877 | $350,864 |
| 2014 | $7,026 | $600,368 | $325,376 | $274,992 |
Source: Public Records
Map
Nearby Homes
- 7849 Camino Glorita
- 7833 Camino Huerta
- 3426 Millikin Ave
- 7986 Camino Jonata
- 3736 Millikin Ave
- 7822 Camino Raposa
- 7837 Camino Tranquilo
- 3995 Camino Lindo
- 3169 Bunche Ave
- 6547 Radcliffe Dr
- 3542 Governor Dr
- 6330 Genesee Ave Unit 112
- 6330 Genesee Ave Unit 220
- 6330 Genesee Ave Unit 213
- 4435 Nobel Dr Unit 19
- 4353 Nobel Dr Unit 64
- 6188 Agee St Unit 230
- 7125 Calabria Ct Unit D
- 8308 Regents Rd Unit 1F
- 8308 Regents Rd Unit 1H