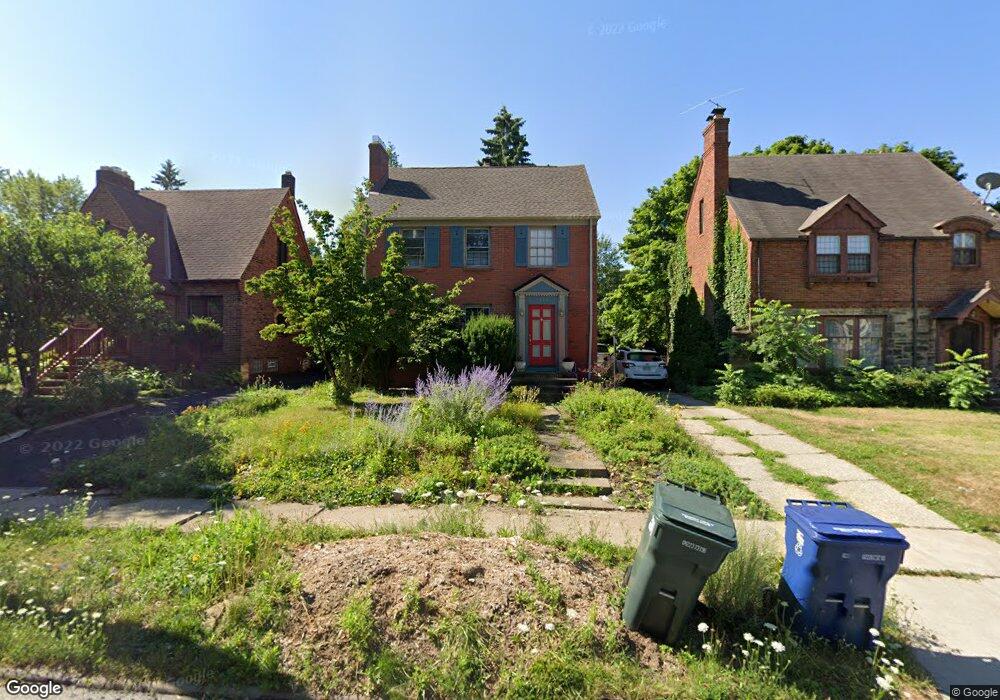
3448 Woodridge Rd Cleveland, OH 44121
Monticello-Noble NeighborhoodEstimated Value: $131,000 - $172,000
3
Beds
2
Baths
1,477
Sq Ft
$107/Sq Ft
Est. Value
About This Home
This home is located at 3448 Woodridge Rd, Cleveland, OH 44121 and is currently estimated at $158,083, approximately $107 per square foot. 3448 Woodridge Rd is a home located in Cuyahoga County with nearby schools including Shaw High School, Yeshiva Derech Hatorah, and Hebrew Academy of Cleveland.
Ownership History
Date
Name
Owned For
Owner Type
Purchase Details
Closed on
Mar 21, 1997
Sold by
Crabtree Thomas R
Bought by
Dickson Duane L and Strenger Virginia E
Current Estimated Value
Home Financials for this Owner
Home Financials are based on the most recent Mortgage that was taken out on this home.
Original Mortgage
$84,350
Outstanding Balance
$10,301
Interest Rate
7.82%
Mortgage Type
New Conventional
Estimated Equity
$147,782
Purchase Details
Closed on
Feb 24, 1993
Sold by
Titas Paul V
Bought by
Crabtree Thomas R
Purchase Details
Closed on
Dec 21, 1981
Sold by
Mills George S
Bought by
Titas Paul
Purchase Details
Closed on
Dec 20, 1978
Sold by
Hughes Thomas S
Bought by
Mills George S
Purchase Details
Closed on
Jan 16, 1976
Sold by
Niekamp Bruce E
Bought by
Hughes Thomas S
Purchase Details
Closed on
Jun 20, 1975
Sold by
Froehlich Richard C and F F
Bought by
Niekamp Bruce E
Purchase Details
Closed on
Jan 1, 1975
Bought by
Froehlich Richard C and F F
Create a Home Valuation Report for This Property
The Home Valuation Report is an in-depth analysis detailing your home's value as well as a comparison with similar homes in the area
Home Values in the Area
Average Home Value in this Area
Purchase History
| Date | Buyer | Sale Price | Title Company |
|---|---|---|---|
| Dickson Duane L | $93,775 | -- | |
| Crabtree Thomas R | $87,000 | -- | |
| Titas Paul | $57,000 | -- | |
| Mills George S | $51,000 | -- | |
| Hughes Thomas S | $36,900 | -- | |
| Niekamp Bruce E | $34,000 | -- | |
| Froehlich Richard C | -- | -- |
Source: Public Records
Mortgage History
| Date | Status | Borrower | Loan Amount |
|---|---|---|---|
| Open | Dickson Duane L | $84,350 |
Source: Public Records
Tax History Compared to Growth
Tax History
| Year | Tax Paid | Tax Assessment Tax Assessment Total Assessment is a certain percentage of the fair market value that is determined by local assessors to be the total taxable value of land and additions on the property. | Land | Improvement |
|---|---|---|---|---|
| 2024 | $4,407 | $51,730 | $9,520 | $42,210 |
| 2023 | $4,404 | $40,400 | $6,830 | $33,570 |
| 2022 | $4,382 | $40,390 | $6,830 | $33,570 |
| 2021 | $4,293 | $40,390 | $6,830 | $33,570 |
| 2020 | $4,278 | $36,400 | $6,160 | $30,240 |
| 2019 | $4,042 | $104,000 | $17,600 | $86,400 |
| 2018 | $4,214 | $36,400 | $6,160 | $30,240 |
| 2017 | $4,633 | $38,890 | $7,390 | $31,500 |
| 2016 | $4,624 | $38,890 | $7,390 | $31,500 |
| 2015 | $4,705 | $38,890 | $7,390 | $31,500 |
| 2014 | $4,705 | $41,830 | $7,950 | $33,880 |
Source: Public Records
Map
Nearby Homes
- 3491 Edison Rd
- 1231 Hereford Rd
- 1111 Hereford Rd
- 1159 Brandon Rd
- 1073 Hereford Rd
- 1412 Copper Trace
- 1151 Haselton Rd
- 1403 Copper Trace Unit 407
- 1417 Slate Ct
- 2257 N Taylor Rd
- 1173 Yellowstone Rd
- 1301 Forest Hills Blvd
- 2256 N Taylor Rd
- 1068 Elbon Rd
- 3430 Mayfield Rd
- 1064 Elbon Rd
- 1148 Rutherford Rd
- 1168 Brentwood Rd
- 1061 Greyton Rd
- 1058 Pembrook Rd
- 3452 Woodridge Rd
- 3444 Woodridge Rd
- 3456 Woodridge Rd
- 3440 Woodridge Rd
- 3460 Woodridge Rd
- 3436 Woodridge Rd
- 3451 Edison Rd
- 1261 Castleton Rd
- 3455 Edison Rd
- 3445 Edison Rd
- 3459 Edison Rd
- 3441 Edison Rd
- 3464 Woodridge Rd
- 1255 Castleton Rd
- 3437 Edison Rd
- 3432 Woodridge Rd
- 3459 Woodridge Rd
- 3470 Woodridge Rd
- 3469 Edison Rd
- 1245 Castleton Rd