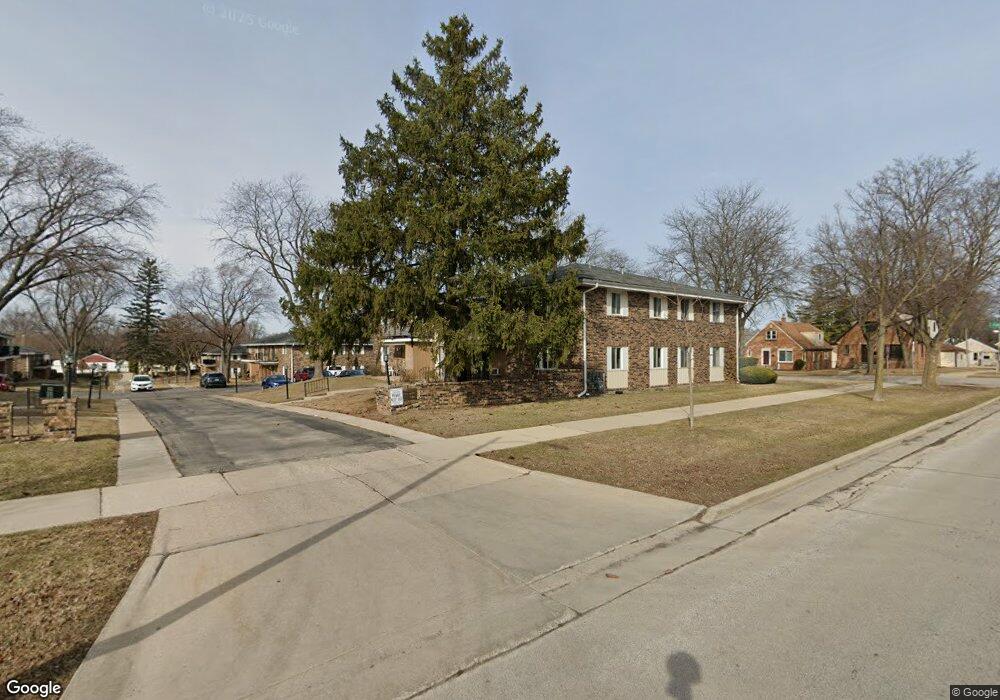
3449 S Pine Ave Milwaukee, WI 53207
Bay View NeighborhoodEstimated Value: $117,000 - $134,592
2
Beds
1
Bath
810
Sq Ft
$158/Sq Ft
Est. Value
About This Home
This home is located at 3449 S Pine Ave, Milwaukee, WI 53207 and is currently estimated at $127,898, approximately $157 per square foot. 3449 S Pine Ave is a home located in Milwaukee County with nearby schools including Milwaukee Spanish Immersion School - Upper Campus, Milwaukee German Immersion School, and Craig Montessori School.
Ownership History
Date
Name
Owned For
Owner Type
Purchase Details
Closed on
Oct 8, 2012
Sold by
Hoffmann Melvin
Bought by
Lanaghan Deborah and Lanaghan Timothy
Current Estimated Value
Home Financials for this Owner
Home Financials are based on the most recent Mortgage that was taken out on this home.
Original Mortgage
$49,400
Interest Rate
3.49%
Purchase Details
Closed on
Jun 7, 2011
Sold by
Hoffmann Marjorie and Hoffmann Melvin
Bought by
Hoffmann Melvin
Purchase Details
Closed on
Jun 19, 2007
Sold by
Hoffmann Melvin
Bought by
Hoffmann Melvin and Hoffmann Marjorie
Home Financials for this Owner
Home Financials are based on the most recent Mortgage that was taken out on this home.
Original Mortgage
$130,500
Interest Rate
5.98%
Mortgage Type
Reverse Mortgage Home Equity Conversion Mortgage
Purchase Details
Closed on
Nov 7, 2001
Sold by
Hoffman Ann D
Bought by
Hoffman Melvin
Create a Home Valuation Report for This Property
The Home Valuation Report is an in-depth analysis detailing your home's value as well as a comparison with similar homes in the area
Home Values in the Area
Average Home Value in this Area
Purchase History
| Date | Buyer | Sale Price | Title Company |
|---|---|---|---|
| Lanaghan Deborah | $48,000 | 1St Service Title | |
| Hoffmann Melvin | -- | None Available | |
| Hoffmann Melvin | -- | None Available | |
| Hoffman Melvin | -- | -- |
Source: Public Records
Mortgage History
| Date | Status | Borrower | Loan Amount |
|---|---|---|---|
| Previous Owner | Lanaghan Deborah | $49,400 | |
| Previous Owner | Hoffmann Melvin | $130,500 |
Source: Public Records
Tax History
| Year | Tax Paid | Tax Assessment Tax Assessment Total Assessment is a certain percentage of the fair market value that is determined by local assessors to be the total taxable value of land and additions on the property. | Land | Improvement |
|---|---|---|---|---|
| 2024 | $1,749 | $92,300 | $5,500 | $86,800 |
| 2023 | $1,820 | $77,000 | $5,500 | $71,500 |
| 2022 | $1,518 | $77,000 | $5,500 | $71,500 |
| 2021 | $1,574 | $71,900 | $5,500 | $66,400 |
| 2020 | $1,623 | $71,900 | $5,500 | $66,400 |
| 2019 | $1,524 | $59,000 | $5,500 | $53,500 |
| 2018 | $1,297 | $59,000 | $5,500 | $53,500 |
| 2017 | $1,271 | $54,000 | $5,500 | $48,500 |
| 2016 | $1,332 | $54,000 | $5,500 | $48,500 |
| 2015 | -- | $54,000 | $5,500 | $48,500 |
| 2014 | -- | $58,700 | $5,500 | $53,200 |
| 2013 | -- | $61,800 | $5,500 | $56,300 |
Source: Public Records
Map
Nearby Homes
- 3613 S Taylor Ave
- 3423 S Clement Ave
- 3602 S Whitnall Ave
- 327 E Holt Ave
- 3370 S Howell Ave
- 3202 S Pine Ave
- 3150 S Lenox St
- 3620 S Howell Ave
- 3175 S California St
- 3207 S Austin St
- 3408 S 1st St
- 3200 S Chase Ave
- 1502 E Tripoli Ave
- 3022 S California St
- 3680 S Alabama Ave
- 3049 S Hanson Ave
- 3429 S 2nd St
- 195 W Warnimont Ave
- 160 E Gauer Cir
- 3673 S Ahmedi Ave
- 3449 S Pine Ave
- 3449 S Pine Ave
- 3449 S Pine Ave
- 3449 S Pine Ave
- 3449 S Pine Ave
- 3449 S Pine Ave
- 3449 S Pine Ave Unit 6
- 3449 S Pine Ave Unit 4
- 723 E Morgan Ave
- 717 E Morgan Ave
- 709 E Morgan Ave
- 3448 S Taylor Ave
- 3448 S Taylor Ave
- 3448 S Taylor Ave
- 3448 S Taylor Ave
- 3448 S Taylor Ave
- 3448 S Taylor Ave
- 3429 S Pine Ave
- 3429 S Pine Ave
- 3429 S Pine Ave
Your Personal Tour Guide
Ask me questions while you tour the home.