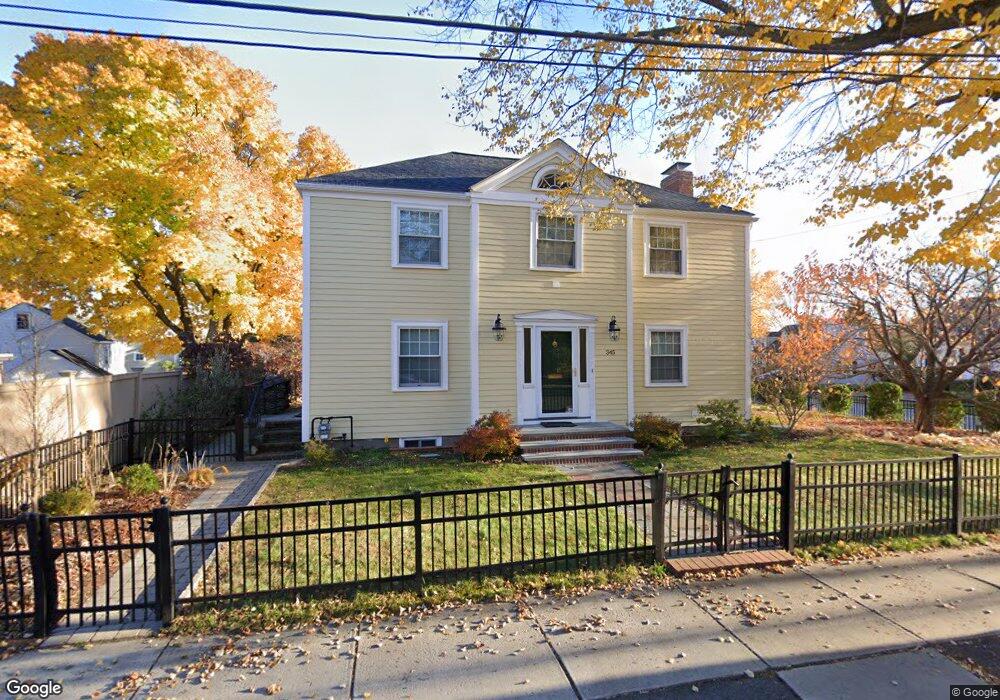
345 Cross St Belmont, MA 02478
Belmont Center NeighborhoodEstimated Value: $1,572,000 - $1,650,000
3
Beds
3
Baths
2,017
Sq Ft
$794/Sq Ft
Est. Value
About This Home
This home is located at 345 Cross St, Belmont, MA 02478 and is currently estimated at $1,601,591, approximately $794 per square foot. 345 Cross St is a home located in Middlesex County with nearby schools including Winn Brook Elementary School, Winthrop L Chenery Middle School, and Belmont High School.
Ownership History
Date
Name
Owned For
Owner Type
Purchase Details
Closed on
Jun 25, 2007
Sold by
Meek Rt and Meek Edwin F
Bought by
Houck Alexandra B and Amaratunga Kevin S
Current Estimated Value
Home Financials for this Owner
Home Financials are based on the most recent Mortgage that was taken out on this home.
Original Mortgage
$551,000
Interest Rate
6.14%
Mortgage Type
Purchase Money Mortgage
Purchase Details
Closed on
Feb 20, 2007
Sold by
Meek Edwin F and Meek Elizabeth C
Bought by
Meek Tr Edwin F and Meek Elizabeth C
Purchase Details
Closed on
Jul 7, 2000
Sold by
Darbeloff Nicholas C and Darbeloff Jill
Bought by
Meek Edwin F and Meek Elizabeth C
Purchase Details
Closed on
Jul 13, 1988
Sold by
Talakoub Ali
Bought by
Darbeloff Nicholas
Create a Home Valuation Report for This Property
The Home Valuation Report is an in-depth analysis detailing your home's value as well as a comparison with similar homes in the area
Home Values in the Area
Average Home Value in this Area
Purchase History
| Date | Buyer | Sale Price | Title Company |
|---|---|---|---|
| Houck Alexandra B | $751,000 | -- | |
| Meek Tr Edwin F | -- | -- | |
| Meek Edwin F | $530,000 | -- | |
| Darbeloff Nicholas | $258,000 | -- |
Source: Public Records
Mortgage History
| Date | Status | Borrower | Loan Amount |
|---|---|---|---|
| Open | Darbeloff Nicholas | $408,000 | |
| Closed | Darbeloff Nicholas | $413,000 | |
| Closed | Houck Alexandra B | $551,000 |
Source: Public Records
Tax History Compared to Growth
Tax History
| Year | Tax Paid | Tax Assessment Tax Assessment Total Assessment is a certain percentage of the fair market value that is determined by local assessors to be the total taxable value of land and additions on the property. | Land | Improvement |
|---|---|---|---|---|
| 2025 | $14,887 | $1,307,000 | $624,000 | $683,000 |
| 2024 | $13,274 | $1,257,000 | $735,000 | $522,000 |
| 2023 | $13,758 | $1,224,000 | $734,000 | $490,000 |
| 2022 | $12,186 | $1,140,000 | $672,000 | $468,000 |
| 2021 | $12,186 | $1,056,000 | $665,000 | $391,000 |
| 2020 | $11,011 | $1,001,000 | $655,000 | $346,000 |
| 2019 | $10,456 | $896,000 | $537,000 | $359,000 |
| 2018 | $6,474 | $842,000 | $483,000 | $359,000 |
| 2017 | $4,802 | $802,000 | $443,000 | $359,000 |
| 2016 | $10,249 | $816,000 | $443,000 | $373,000 |
| 2015 | $9,662 | $749,000 | $376,000 | $373,000 |
Source: Public Records
Map
Nearby Homes
- 326 Lake St
- 242 Claflin St
- 314 Channing Rd
- 43 Brunswick Rd
- 4 Stony Brook Rd
- 7 Broad St
- 10 Radcliffe Rd
- 176 Channing Rd
- 31 Pondview Rd Unit 33
- 73 Trowbridge St Unit 73A
- 73 Trowbridge St Unit 73B
- 125 Claflin St
- 7 Woodland St
- 125 Channing Rd
- 55 S Normandy Ave
- 135 Pleasant St Unit 34 prev 13
- 59 Hamilton Rd
- 22 Hamilton Rd Unit 206
- 93 Griswold St Unit 93
- 48 Hamilton Rd