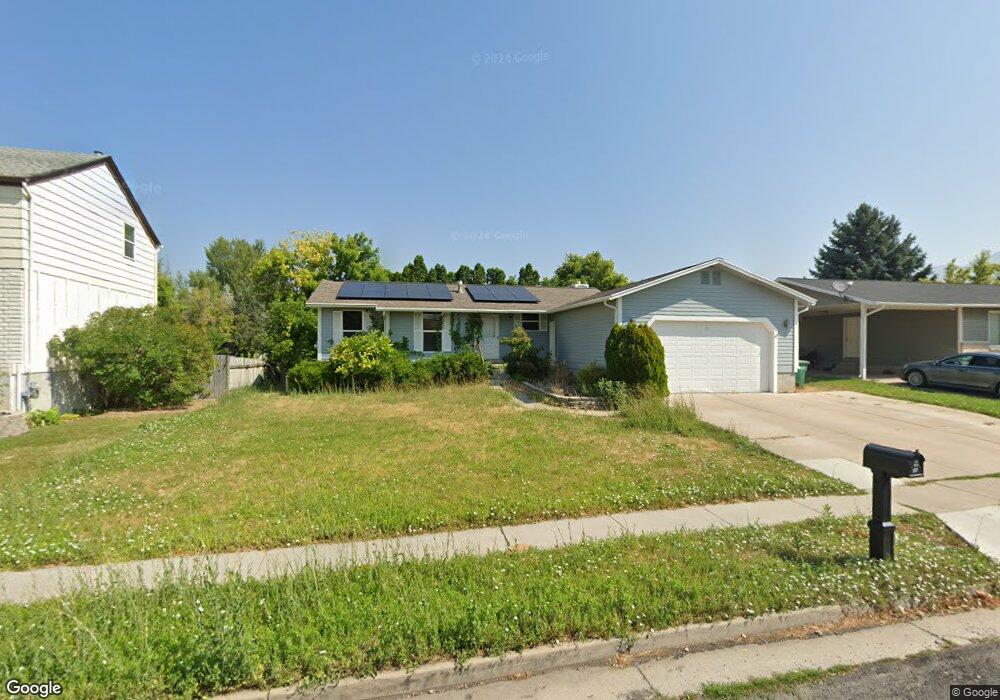
345 E 1200 N Logan, UT 84341
Adams NeighborhoodEstimated Value: $411,000 - $489,000
5
Beds
2
Baths
2,410
Sq Ft
$187/Sq Ft
Est. Value
About This Home
This home is located at 345 E 1200 N, Logan, UT 84341 and is currently estimated at $449,830, approximately $186 per square foot. 345 E 1200 N is a home located in Cache County with nearby schools including Adams Elementary School, Mount Logan Middle School, and Logan High School.
Ownership History
Date
Name
Owned For
Owner Type
Purchase Details
Closed on
Jan 21, 2022
Sold by
Michael Folland
Bought by
Folland Michael and He Shan
Current Estimated Value
Home Financials for this Owner
Home Financials are based on the most recent Mortgage that was taken out on this home.
Original Mortgage
$391,500
Outstanding Balance
$306,006
Interest Rate
3.45%
Mortgage Type
New Conventional
Estimated Equity
$143,824
Purchase Details
Closed on
Jan 20, 2022
Sold by
Earl Eldridge David
Bought by
Eldridge David Earl
Home Financials for this Owner
Home Financials are based on the most recent Mortgage that was taken out on this home.
Original Mortgage
$391,500
Outstanding Balance
$306,006
Interest Rate
3.45%
Mortgage Type
New Conventional
Estimated Equity
$143,824
Create a Home Valuation Report for This Property
The Home Valuation Report is an in-depth analysis detailing your home's value as well as a comparison with similar homes in the area
Home Values in the Area
Average Home Value in this Area
Purchase History
| Date | Buyer | Sale Price | Title Company |
|---|---|---|---|
| Folland Michael | -- | Pinnacle Title | |
| Eldridge David Earl | -- | Stewart Title Insurance Agency |
Source: Public Records
Mortgage History
| Date | Status | Borrower | Loan Amount |
|---|---|---|---|
| Open | Folland Michael | $391,500 | |
| Closed | Eldridge David Earl | $391,500 |
Source: Public Records
Tax History
| Year | Tax Paid | Tax Assessment Tax Assessment Total Assessment is a certain percentage of the fair market value that is determined by local assessors to be the total taxable value of land and additions on the property. | Land | Improvement |
|---|---|---|---|---|
| 2025 | $2,082 | $269,225 | $0 | $0 |
| 2024 | $2,149 | $269,225 | $0 | $0 |
| 2023 | $2,243 | $267,850 | $0 | $0 |
| 2022 | $2,032 | $226,600 | $0 | $0 |
| 2021 | $1,603 | $276,200 | $50,000 | $226,200 |
| 2020 | $1,538 | $238,500 | $50,000 | $188,500 |
| 2019 | $1,395 | $206,873 | $50,000 | $156,873 |
| 2018 | $1,351 | $182,944 | $50,000 | $132,944 |
| 2017 | $1,234 | $88,385 | $0 | $0 |
| 2016 | $1,280 | $88,385 | $0 | $0 |
| 2015 | $1,281 | $88,385 | $0 | $0 |
| 2014 | $1,070 | $81,620 | $0 | $0 |
| 2013 | -- | $81,620 | $0 | $0 |
Source: Public Records
Map
Nearby Homes
- 359 E 1075 N
- 1007 Bonneville Ave
- 252 E 1000 N
- 1188 N 600 E
- 633 E 1260 N
- 648 E 1280 N
- 643 E 1280 N
- 395 E 1530 N
- 1177 N 680 E
- 1167 N 680 E
- 239 E 1530 N
- 1238 E Talmage Ln Unit 33
- 1366 N Talmage Ln Unit 35
- 1367 E 1280 N
- 1261 E Talmage Ln Unit 59
- 1241 E Talmage Ln Unit 31
- 1246 E Talmage Ln Unit 32
- 55 Heritage Cove
- 704 N 200 E
- 272 E 1725 N Unit 3
Your Personal Tour Guide
Ask me questions while you tour the home.