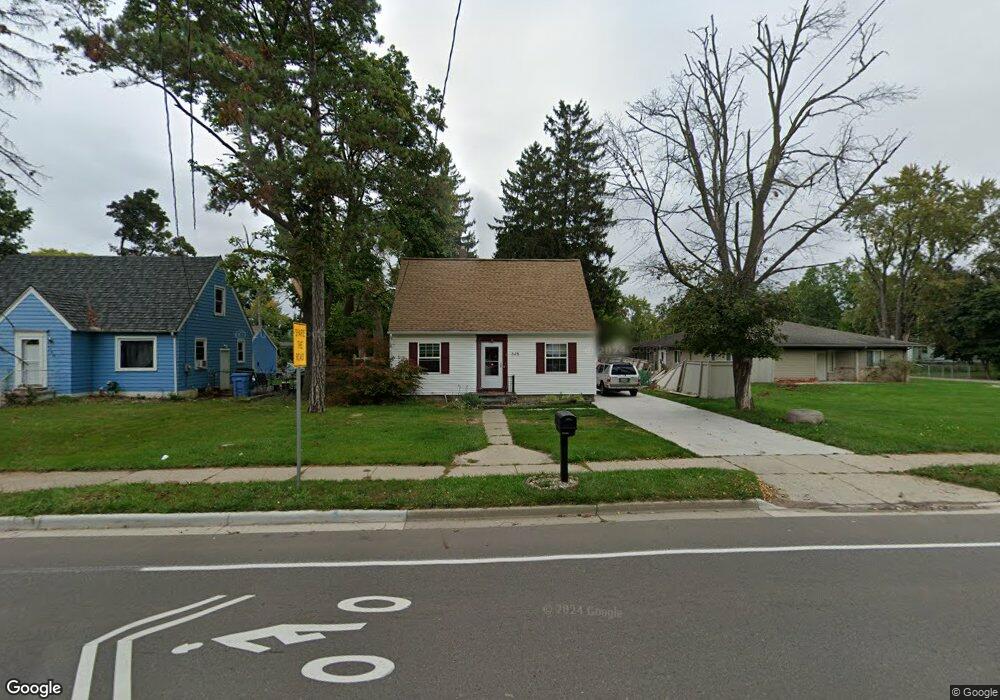
345 E Miller Rd Lansing, MI 48911
Southern Lansing NeighborhoodEstimated Value: $93,000 - $182,000
3
Beds
1
Bath
900
Sq Ft
$150/Sq Ft
Est. Value
About This Home
This home is located at 345 E Miller Rd, Lansing, MI 48911 and is currently estimated at $134,574, approximately $149 per square foot. 345 E Miller Rd is a home located in Ingham County with nearby schools including North Elementary School, Everett High School, and Immaculate Heart of Mary/St Casimir School.
Ownership History
Date
Name
Owned For
Owner Type
Purchase Details
Closed on
Jul 12, 2022
Sold by
Sharp Christopher T and Sharp Margo C
Bought by
Sharp Christopher T and Sharp Margo C
Current Estimated Value
Purchase Details
Closed on
Nov 25, 2009
Sold by
Ht Schultz Builder & Developer
Bought by
Sharp Margo C
Home Financials for this Owner
Home Financials are based on the most recent Mortgage that was taken out on this home.
Original Mortgage
$68,633
Interest Rate
5.05%
Mortgage Type
FHA
Purchase Details
Closed on
Jan 7, 2009
Sold by
Schultz Herbert T and Schultz Donna
Bought by
H T Shultz Builder & Developer Inc
Purchase Details
Closed on
Apr 17, 2008
Sold by
Richardson Kathleen F and Richardson James
Bought by
Citimortgage Inc
Purchase Details
Closed on
Dec 1, 1993
Create a Home Valuation Report for This Property
The Home Valuation Report is an in-depth analysis detailing your home's value as well as a comparison with similar homes in the area
Home Values in the Area
Average Home Value in this Area
Purchase History
| Date | Buyer | Sale Price | Title Company |
|---|---|---|---|
| Sharp Christopher T | -- | None Listed On Document | |
| Sharp Margo C | $69,900 | Midstate | |
| H T Shultz Builder & Developer Inc | -- | First American Title Ins Co | |
| Citimortgage Inc | $50,318 | None Available | |
| -- | $49,000 | -- |
Source: Public Records
Mortgage History
| Date | Status | Borrower | Loan Amount |
|---|---|---|---|
| Previous Owner | Sharp Margo C | $68,633 |
Source: Public Records
Tax History
| Year | Tax Paid | Tax Assessment Tax Assessment Total Assessment is a certain percentage of the fair market value that is determined by local assessors to be the total taxable value of land and additions on the property. | Land | Improvement |
|---|---|---|---|---|
| 2025 | $1,940 | $58,900 | $9,600 | $49,300 |
| 2024 | $15 | $46,100 | $9,600 | $36,500 |
| 2023 | $1,821 | $41,300 | $9,600 | $31,700 |
| 2022 | $1,645 | $36,700 | $8,800 | $27,900 |
| 2021 | $1,611 | $31,700 | $5,700 | $26,000 |
| 2020 | $1,601 | $29,800 | $5,700 | $24,100 |
| 2019 | $1,533 | $25,300 | $5,700 | $19,600 |
| 2018 | $1,439 | $24,400 | $5,700 | $18,700 |
| 2017 | $1,377 | $24,400 | $5,700 | $18,700 |
| 2016 | $1,317 | $24,000 | $5,700 | $18,300 |
| 2015 | $1,317 | $23,100 | $11,488 | $11,612 |
| 2014 | $1,317 | $22,700 | $15,317 | $7,383 |
Source: Public Records
Map
Nearby Homes
- 6246 Gardenia Ave
- 115 E Claremore Dr
- 208 E Northrup St
- 6429 Rosedale Rd
- 125 E Northrup St
- 6444 Sommerset Rd
- 6264 Beechfield Dr Unit 97
- 6300 Beechfield Dr Unit 87
- 6421 S Washington Ave
- 826 R G Curtiss Ave
- 6317 Beechfield Dr Unit 49
- 6321 Beechfield Dr Unit 37
- 5267 Crocus Ave
- 6331 Beechfield Dr Unit 42
- 6341 Beechfield Dr Unit 53
- 1265 Roth Dr
- 1115 Shirley St
- 205 E Jolly Rd Unit 6
- 5008 Southgate Ave
- 6704 Mill Stream Ln
Your Personal Tour Guide
Ask me questions while you tour the home.