345 Elm St Springfield, NE 68059
Estimated Value: $234,000 - $273,528
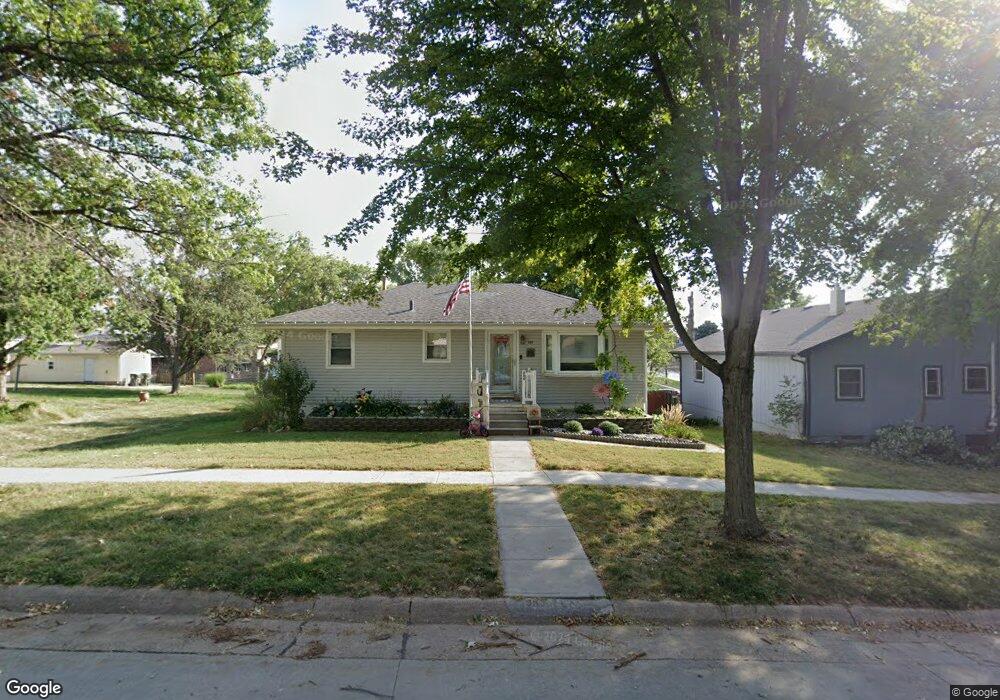
About This Home
This home is located at 345 Elm St, Springfield, NE 68059 and is currently estimated at $257,132, approximately $141 per square foot. 345 Elm St is a home located in Sarpy County with nearby schools including Platteview Central Junior High School and Platteview Senior High School.
Ownership History
We collect this data history from publicly available records. To have your information removed, we recommend requesting removal directly through your county’s website.
Purchase Details
Purchase Details
Home Financials for this Owner
Home Financials are based on the most recent Mortgage that was taken out on this home.Purchase Details
Purchase Details
Home Financials for this Owner
Home Financials are based on the most recent Mortgage that was taken out on this home.Purchase History
We collect this data history from publicly available records. To have your information removed, we recommend requesting removal directly through your county’s website.
| Date | Buyer | Sale Price | Title Company |
|---|---|---|---|
| $232,000 | Dri Title & Escrow | ||
| $110,000 | Rels Title Omaha | ||
| -- | None Available | ||
| $80,000 | Ati Title |
Mortgage History
We collect this data history from publicly available records. To have your information removed, we recommend requesting removal directly through your county’s website.
| Date | Status | Borrower | Loan Amount |
|---|---|---|---|
| Previous Owner | $107,211 | ||
| Previous Owner | $78,850 |
Tax History
We collect this data history from publicly available records. To have your information removed, we recommend requesting removal directly through your county’s website.
| Year | Tax Paid | Tax Assessment Tax Assessment Total Assessment is a certain percentage of the fair market value that is determined by local assessors to be the total taxable value of land and additions on the property. | Land | Improvement |
|---|---|---|---|---|
| 2025 | $2,303 | $212,240 | $29,403 | $182,837 |
| 2024 | $2,736 | $185,928 | $29,403 | $156,525 |
| 2023 | $2,736 | $169,698 | $23,522 | $146,176 |
| 2022 | $2,735 | $149,836 | $23,522 | $126,314 |
| 2021 | $2,877 | $143,912 | $20,038 | $123,874 |
| 2020 | $3,034 | $141,690 | $20,038 | $121,652 |
| 2019 | $3,011 | $138,890 | $20,038 | $118,852 |
| 2018 | $2,845 | $129,899 | $20,038 | $109,861 |
| 2017 | $2,862 | $124,905 | $20,038 | $104,867 |
| 2016 | $2,759 | $119,079 | $20,038 | $99,041 |
| 2015 | $2,568 | $109,360 | $16,117 | $93,243 |
| 2014 | $2,563 | $108,241 | $16,117 | $92,124 |
| 2012 | -- | $110,141 | $16,117 | $94,024 |
Map
- 360 Main St
- 220 N 10th Ave
- 805 N 10th Ave
- 225 N 10th Ave
- SE 1/4 18-13-12 Platteview Rd
- 680 N 11th Cir
- 1001 Spruce St
- 13268 Bluebird Ct
- 19970 S 172 Plaza Cir
- 12706 Cottonwood Ln
- 12611 Cottonwood Ln
- Lots 103 to 106 Villa Springs
- 111 acres Platteview Rd
- 2036 Platteview Dr
- 2040 Platteview Dr
- 2056 Platteview Dr
- 3021 Sunset Dr
- Lot 108
- 11663 S 123rd St
- 11575 Hardwood Dr
Ask me questions while you tour the home.