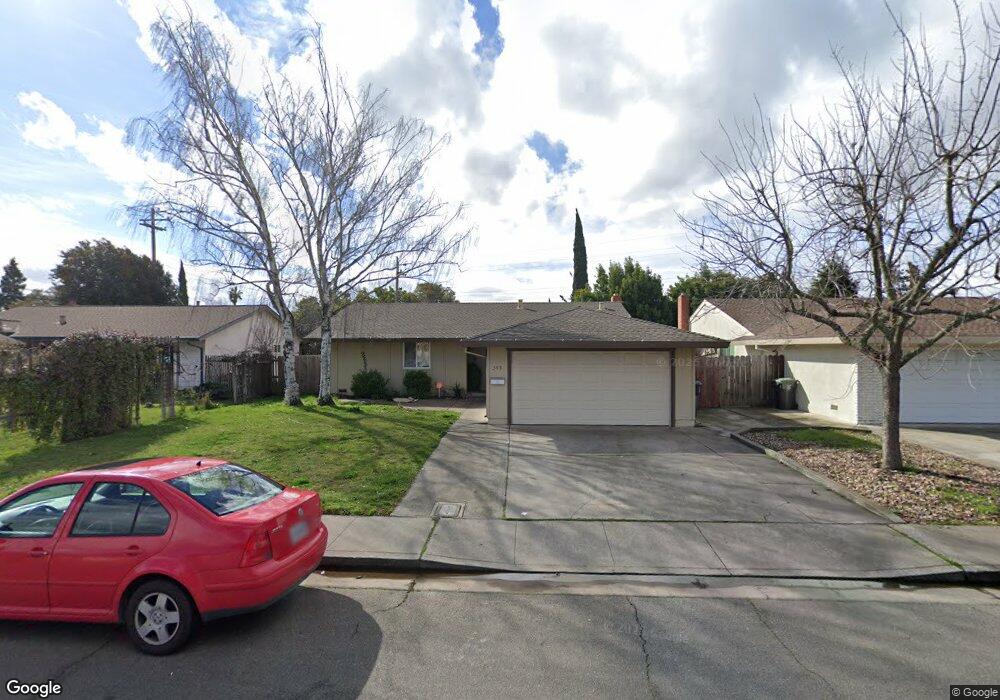
345 Lily St Fairfield, CA 94533
Estimated Value: $500,000 - $518,000
4
Beds
2
Baths
1,438
Sq Ft
$357/Sq Ft
Est. Value
About This Home
This home is located at 345 Lily St, Fairfield, CA 94533 and is currently estimated at $512,787, approximately $356 per square foot. 345 Lily St is a home located in Solano County with nearby schools including Dover Elementary School, Grange Middle School, and Fairfield High School.
Ownership History
Date
Name
Owned For
Owner Type
Purchase Details
Closed on
Feb 3, 2017
Sold by
Hill Jennifer J
Bought by
Hill John W and Hill Jennifer J
Current Estimated Value
Purchase Details
Closed on
Apr 24, 2002
Sold by
Hill John W
Bought by
Hill Jennifer J
Home Financials for this Owner
Home Financials are based on the most recent Mortgage that was taken out on this home.
Original Mortgage
$27,000
Outstanding Balance
$11,408
Interest Rate
7.08%
Estimated Equity
$501,379
Purchase Details
Closed on
Dec 19, 1995
Sold by
Trumbull William C
Bought by
Hill Jennifer J
Create a Home Valuation Report for This Property
The Home Valuation Report is an in-depth analysis detailing your home's value as well as a comparison with similar homes in the area
Home Values in the Area
Average Home Value in this Area
Purchase History
| Date | Buyer | Sale Price | Title Company |
|---|---|---|---|
| Hill John W | -- | None Available | |
| Hill Jennifer J | -- | First American | |
| Hill Jennifer J | -- | -- |
Source: Public Records
Mortgage History
| Date | Status | Borrower | Loan Amount |
|---|---|---|---|
| Open | Hill Jennifer J | $27,000 |
Source: Public Records
Tax History Compared to Growth
Tax History
| Year | Tax Paid | Tax Assessment Tax Assessment Total Assessment is a certain percentage of the fair market value that is determined by local assessors to be the total taxable value of land and additions on the property. | Land | Improvement |
|---|---|---|---|---|
| 2025 | $1,038 | $90,581 | $14,672 | $75,909 |
| 2024 | $1,038 | $88,806 | $14,385 | $74,421 |
| 2023 | $1,007 | $87,065 | $14,103 | $72,962 |
| 2022 | $995 | $85,359 | $13,827 | $71,532 |
| 2021 | $985 | $83,686 | $13,556 | $70,130 |
| 2020 | $963 | $82,828 | $13,417 | $69,411 |
| 2019 | $940 | $81,204 | $13,154 | $68,050 |
| 2018 | $969 | $79,613 | $12,897 | $66,716 |
| 2017 | $926 | $78,053 | $12,645 | $65,408 |
| 2016 | $910 | $76,524 | $12,398 | $64,126 |
| 2015 | $850 | $75,375 | $12,212 | $63,163 |
| 2014 | $843 | $73,899 | $11,973 | $61,926 |
Source: Public Records
Map
Nearby Homes