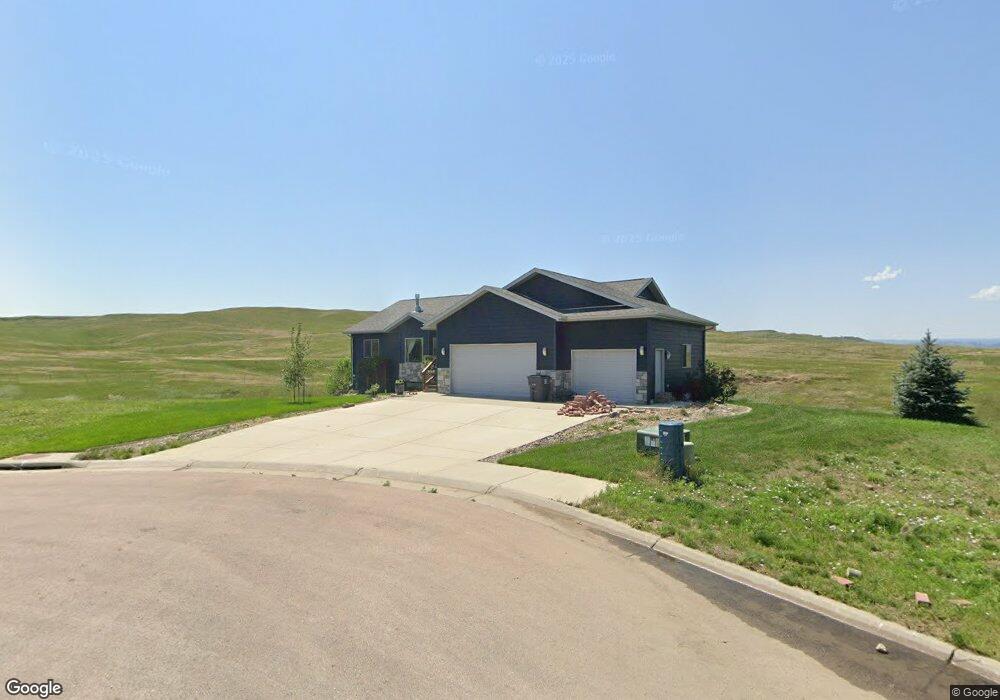
345 Lone Soldier Ct Box Elder, SD 57719
Estimated Value: $360,000 - $527,000
4
Beds
3
Baths
1,516
Sq Ft
$301/Sq Ft
Est. Value
About This Home
This home is located at 345 Lone Soldier Ct, Box Elder, SD 57719 and is currently estimated at $455,572, approximately $300 per square foot. 345 Lone Soldier Ct is a home located in Pennington County with nearby schools including Francis Case Elementary - 04, Badger Clark/Carrousel - 05, and Vandenberg Elementary School.
Ownership History
Date
Name
Owned For
Owner Type
Purchase Details
Closed on
Feb 25, 2014
Sold by
Not Provided
Bought by
Stillens Jason P and Stillens Theresa A
Current Estimated Value
Home Financials for this Owner
Home Financials are based on the most recent Mortgage that was taken out on this home.
Original Mortgage
$279,700
Outstanding Balance
$212,083
Interest Rate
4.35%
Mortgage Type
Purchase Money Mortgage
Estimated Equity
$243,489
Purchase Details
Closed on
Dec 23, 2013
Sold by
Not Provided
Bought by
H-S Holdings Llc
Home Financials for this Owner
Home Financials are based on the most recent Mortgage that was taken out on this home.
Original Mortgage
$279,700
Interest Rate
4.35%
Mortgage Type
Purchase Money Mortgage
Purchase Details
Closed on
Jul 30, 2013
Bought by
Knock Enterprises Inc
Create a Home Valuation Report for This Property
The Home Valuation Report is an in-depth analysis detailing your home's value as well as a comparison with similar homes in the area
Home Values in the Area
Average Home Value in this Area
Purchase History
| Date | Buyer | Sale Price | Title Company |
|---|---|---|---|
| Stillens Jason P | -- | -- | |
| H-S Holdings Llc | -- | -- | |
| Knock Enterprises Inc | -- | -- |
Source: Public Records
Mortgage History
| Date | Status | Borrower | Loan Amount |
|---|---|---|---|
| Open | Stillens Jason P | $279,700 | |
| Previous Owner | H-S Holdings Llc | $279,700 |
Source: Public Records
Tax History
| Year | Tax Paid | Tax Assessment Tax Assessment Total Assessment is a certain percentage of the fair market value that is determined by local assessors to be the total taxable value of land and additions on the property. | Land | Improvement |
|---|---|---|---|---|
| 2025 | $6,939 | $499,800 | $46,500 | $453,300 |
| 2024 | $6,939 | $522,800 | $46,500 | $476,300 |
| 2023 | $6,808 | $501,800 | $46,500 | $455,300 |
| 2022 | $6,162 | $424,300 | $46,500 | $377,800 |
| 2021 | $5,895 | $355,600 | $34,500 | $321,100 |
| 2020 | $5,855 | $335,500 | $34,500 | $301,000 |
| 2019 | $5,611 | $314,800 | $34,500 | $280,300 |
| 2018 | $5,142 | $293,700 | $34,500 | $259,200 |
| 2017 | $4,924 | $306,800 | $33,300 | $273,500 |
| 2016 | $5,039 | $283,700 | $33,300 | $250,400 |
| 2015 | $5,039 | $294,000 | $33,300 | $260,700 |
| 2014 | $1,839 | $106,600 | $32,000 | $74,600 |
Source: Public Records
Map
Nearby Homes
- 340 Lone Soldier Ct
- 387 Big Badger Dr
- 734 Old Cavalry Rd
- 748 Bear Tooth Ct
- 305 Bear Tooth Dr
- 317 Bear Tooth Dr
- 14800 Radar Hills Dr
- 14810 Radar Hills Dr
- 22763 Mule Deer Trail
- 14828 Fox Trail
- 22745 Rando Ct
- 22727 Rando Ct
- 477 Coyote Trail
- TBD Alpha Ave
- L5B10 Alpha Ave
- L8B10 Alpha Ave
- L3B10 Alpha Ave
- L7B10 Alpha Ave
- L10B10 Alpha Ave
- L6B10 Alpha Ave
- 339 Lone Soldier Ct
- lot 27c Lone Soldier Ct
- 352 Lone Soldier Ct
- TBD C27 Lone Soldier Ct
- TBD C25 Lone Soldier Ct
- 333 Lone Soldier Ct
- 346 Lone Soldier Ct
- 334 Lone Soldier Ct
- 327 Lone Soldier Ct
- 328 Lone Soldier Ct
- 339 Big Badger Dr
- 345 Big Badger Dr
- 333 Big Badger Dr
- 323 Lone Soldier Ct
- 327 Big Badger Dr
- 351 Big Badger Dr
- 322 Lone Soldier Ct
- 357 Big Badger Dr
- lot 29c Lone Soldier Ct
- 321 Big Badger Dr
Your Personal Tour Guide
Ask me questions while you tour the home.