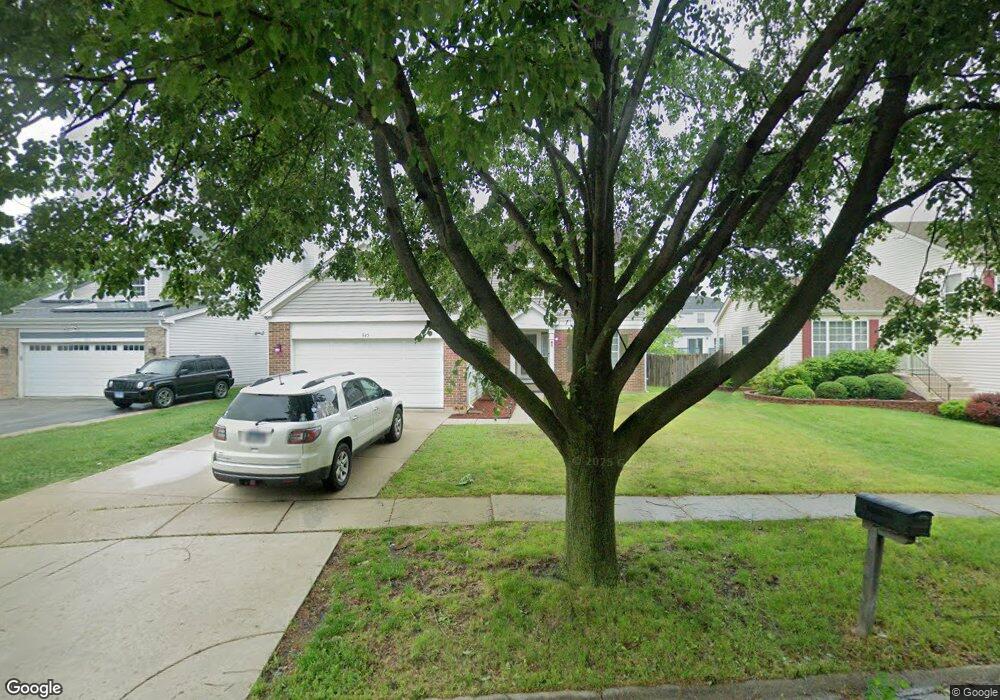
345 Meadowlark Dr Unit 2 Bolingbrook, IL 60440
East Bolingbrook NeighborhoodEstimated Value: $370,000 - $416,000
4
Beds
3
Baths
1,988
Sq Ft
$196/Sq Ft
Est. Value
About This Home
This home is located at 345 Meadowlark Dr Unit 2, Bolingbrook, IL 60440 and is currently estimated at $389,587, approximately $195 per square foot. 345 Meadowlark Dr Unit 2 is a home located in Will County with nearby schools including Independence Elementary School, Jane Addams Middle School, and Bolingbrook High School.
Ownership History
Date
Name
Owned For
Owner Type
Purchase Details
Closed on
Oct 30, 2014
Sold by
Davis Terry
Bought by
Matthews Stephanie S
Current Estimated Value
Home Financials for this Owner
Home Financials are based on the most recent Mortgage that was taken out on this home.
Original Mortgage
$157,102
Outstanding Balance
$117,486
Interest Rate
3.37%
Mortgage Type
FHA
Estimated Equity
$272,101
Purchase Details
Closed on
Sep 15, 2010
Sold by
Najacht Jason C and Najacht Xenia A
Bought by
Davis Terry
Purchase Details
Closed on
Jul 9, 2004
Sold by
French Cecil W and French Marilyn D
Bought by
Najacht Jason C and Najacht Xenia A
Home Financials for this Owner
Home Financials are based on the most recent Mortgage that was taken out on this home.
Original Mortgage
$172,000
Interest Rate
6.42%
Mortgage Type
Purchase Money Mortgage
Purchase Details
Closed on
Sep 30, 1995
Sold by
Oak Brook Bank
Bought by
French Cecil W and French Marilyn D
Create a Home Valuation Report for This Property
The Home Valuation Report is an in-depth analysis detailing your home's value as well as a comparison with similar homes in the area
Home Values in the Area
Average Home Value in this Area
Purchase History
| Date | Buyer | Sale Price | Title Company |
|---|---|---|---|
| Matthews Stephanie S | $160,000 | First American | |
| Davis Terry | $217,500 | Law Title Insurance | |
| Najacht Jason C | $232,000 | Law Title | |
| French Cecil W | $156,000 | -- |
Source: Public Records
Mortgage History
| Date | Status | Borrower | Loan Amount |
|---|---|---|---|
| Open | Matthews Stephanie S | $157,102 | |
| Previous Owner | Najacht Jason C | $172,000 |
Source: Public Records
Tax History
| Year | Tax Paid | Tax Assessment Tax Assessment Total Assessment is a certain percentage of the fair market value that is determined by local assessors to be the total taxable value of land and additions on the property. | Land | Improvement |
|---|---|---|---|---|
| 2024 | $9,227 | $107,904 | $18,896 | $89,008 |
| 2023 | $8,642 | $97,088 | $17,002 | $80,086 |
| 2022 | $8,642 | $87,530 | $15,328 | $72,202 |
| 2021 | $7,635 | $81,842 | $14,332 | $67,510 |
| 2020 | $7,399 | $79,151 | $13,861 | $65,290 |
| 2019 | $7,158 | $75,382 | $13,201 | $62,181 |
| 2018 | $6,871 | $72,150 | $12,635 | $59,515 |
| 2017 | $6,539 | $68,388 | $11,976 | $56,412 |
| 2016 | $6,347 | $65,100 | $11,400 | $53,700 |
| 2015 | $6,580 | $62,400 | $10,900 | $51,500 |
| 2014 | $6,580 | $60,600 | $10,600 | $50,000 |
| 2013 | $6,580 | $67,400 | $11,800 | $55,600 |
Source: Public Records
Map
Nearby Homes
- 528 Alcott Ln
- 450 Lily Cache Ln
- 548 Larkspur Dr
- 209 Mill Stream Dr
- 209 Bunker Hill Dr
- 309 Emerald Ct Unit 15/4
- 372 Windsong Ct Unit 4110
- 164 Galewood Dr
- 160 Galewood Dr
- 401 Foxborough Trail
- 10 Fernwood Dr Unit L
- 80 Fernwood Dr Unit O
- 217 S Orchard Dr
- 5 E Fernwood Dr
- 118 Springleaf Dr Unit 5
- 313 Fox Bend Cir
- 4 Franklin Ct Unit 2
- 426 Greentree Ln Unit 6
- 184 Fox Bend Cir
- 226 Grant Dr
- 351 Meadowlark Dr
- 339 Meadowlark Dr
- 489 Bloomfield Dr Unit 1
- 333 Meadowlark Dr
- 485 Bloomfield Dr
- 493 Bloomfield Dr
- 357 Meadowlark Dr
- 368 Meadowlark Dr
- 374 Meadowlark Dr
- 481 Bloomfield Dr Unit 1
- 497 Bloomfield Dr
- 362 Meadowlark Dr
- 363 Meadowlark Dr Unit 2
- 369 Meadowlark Dr Unit 2
- 356 Meadowlark Dr
- 380 Meadowlark Dr
- 501 Bloomfield Dr Unit 1
- 375 Meadowlark Dr
- 336 Wildflower Way Unit 1
- 340 Wildflower Way
Your Personal Tour Guide
Ask me questions while you tour the home.