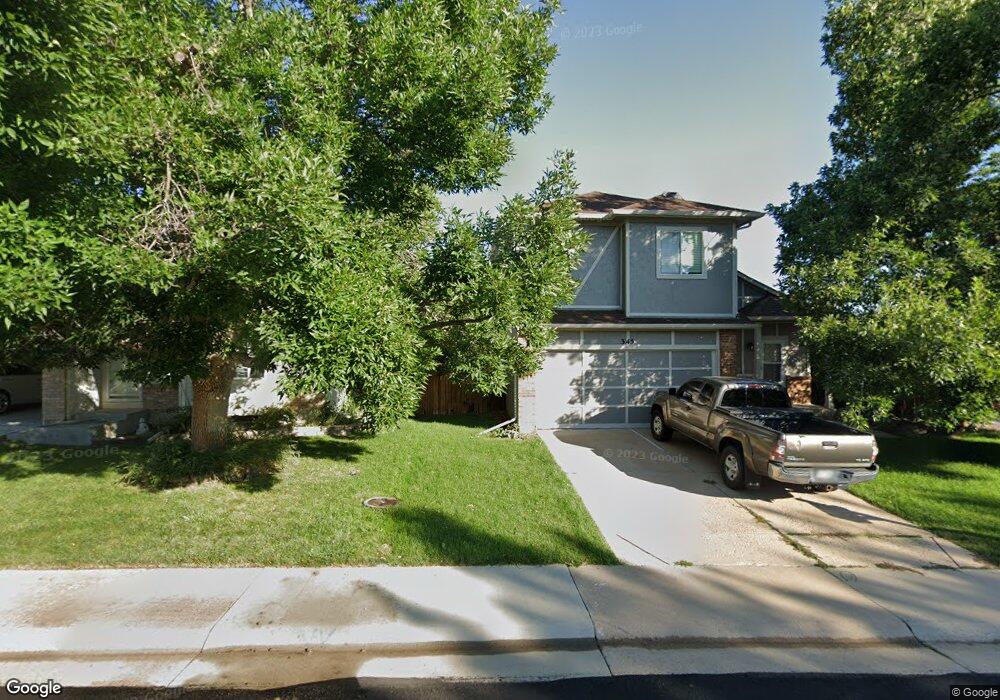
345 N Holcomb St Castle Rock, CO 80104
Founders Village NeighborhoodEstimated Value: $458,000 - $485,000
3
Beds
2
Baths
1,894
Sq Ft
$250/Sq Ft
Est. Value
About This Home
This home is located at 345 N Holcomb St, Castle Rock, CO 80104 and is currently estimated at $473,498, approximately $249 per square foot. 345 N Holcomb St is a home located in Douglas County with nearby schools including Rock Ridge Elementary School, Mesa Middle School, and Douglas County High School.
Ownership History
Date
Name
Owned For
Owner Type
Purchase Details
Closed on
Nov 30, 2015
Sold by
Velasquez Fernando and Velasquez Mary
Bought by
Kahn Jason A
Current Estimated Value
Home Financials for this Owner
Home Financials are based on the most recent Mortgage that was taken out on this home.
Original Mortgage
$250,381
Outstanding Balance
$197,212
Interest Rate
3.75%
Mortgage Type
FHA
Estimated Equity
$276,286
Purchase Details
Closed on
Dec 31, 2013
Sold by
Velasquez Fernando
Bought by
Velasquez Fernando and Velasquez Mary
Purchase Details
Closed on
Sep 24, 2013
Sold by
Holderfield Gaylen B
Bought by
Velasquez Fernando
Purchase Details
Closed on
Jun 24, 1993
Sold by
Holderfield Keith A and Holderfield Gaylene B
Bought by
Holderfield Gaylene B
Purchase Details
Closed on
Nov 18, 1986
Sold by
Nash Phillips Copus Inc
Bought by
Holderfield Keith A and Holderfield Gaylene B
Purchase Details
Closed on
Mar 14, 1986
Sold by
Castle Rock Village Development Corp
Bought by
Nash Phillips Copus Inc
Create a Home Valuation Report for This Property
The Home Valuation Report is an in-depth analysis detailing your home's value as well as a comparison with similar homes in the area
Home Values in the Area
Average Home Value in this Area
Purchase History
| Date | Buyer | Sale Price | Title Company |
|---|---|---|---|
| Kahn Jason A | $255,000 | Land Title Guarantee | |
| Velasquez Fernando | -- | None Available | |
| Velasquez Fernando | -- | None Available | |
| Holderfield Gaylene B | -- | -- | |
| Holderfield Keith A | $87,800 | -- | |
| Nash Phillips Copus Inc | $537,500 | -- |
Source: Public Records
Mortgage History
| Date | Status | Borrower | Loan Amount |
|---|---|---|---|
| Open | Kahn Jason A | $250,381 |
Source: Public Records
Tax History Compared to Growth
Tax History
| Year | Tax Paid | Tax Assessment Tax Assessment Total Assessment is a certain percentage of the fair market value that is determined by local assessors to be the total taxable value of land and additions on the property. | Land | Improvement |
|---|---|---|---|---|
| 2024 | $4,711 | $32,360 | $7,490 | $24,870 |
| 2023 | $4,739 | $32,360 | $7,490 | $24,870 |
| 2022 | $3,491 | $22,050 | $5,540 | $16,510 |
| 2021 | $3,555 | $22,050 | $5,540 | $16,510 |
| 2020 | $3,381 | $21,580 | $4,430 | $17,150 |
| 2019 | $3,383 | $21,580 | $4,430 | $17,150 |
| 2018 | $2,955 | $18,710 | $4,010 | $14,700 |
| 2017 | $2,845 | $18,710 | $4,010 | $14,700 |
| 2016 | $2,327 | $15,980 | $3,900 | $12,080 |
| 2015 | $2,357 | $15,980 | $3,900 | $12,080 |
| 2014 | $899 | $11,710 | $3,420 | $8,290 |
Source: Public Records
Map
Nearby Homes
- 535 Howe St
- 5326 E Howe St
- 5323 E Sandpiper Ave
- 364 N Willow St
- 612 Blue Teal Dr
- 650 Howe Cir
- 690 Howe Ct
- 718 Blue Teal Dr
- 5521 Spruce Ave
- 176 S Pembrook St
- 330 N Wagonwheel Trail
- 109 N Quicksilver Ave
- 5617 E Prescott Ave
- 613 N Brentwood Ct
- 950 Sundown Dr
- 5181 Devon Ave
- 5282 Devon Ave
- 321 Lockwood St
- 157 S Quicksilver Ave
- 152 Las Lunas St
- 335 N Holcomb St
- 365 N Holcomb St
- 325 N Holcomb St
- 385 N Holcomb St
- 350 N Holcomb St
- 330 N Holcomb St
- 315 N Holcomb St
- 310 N Holcomb St
- 370 N Holcomb St
- 390 N Holcomb St
- 305 N Holcomb St
- 290 N Holcomb St
- 501 Howe St
- 295 N Holcomb St
- 301 E Holcomb Cir
- 271 E Holcomb Cir
- 5231 E Howe St
- 5211 E Howe St
- 5238 E Howe St
- 271 N Holcomb Cir