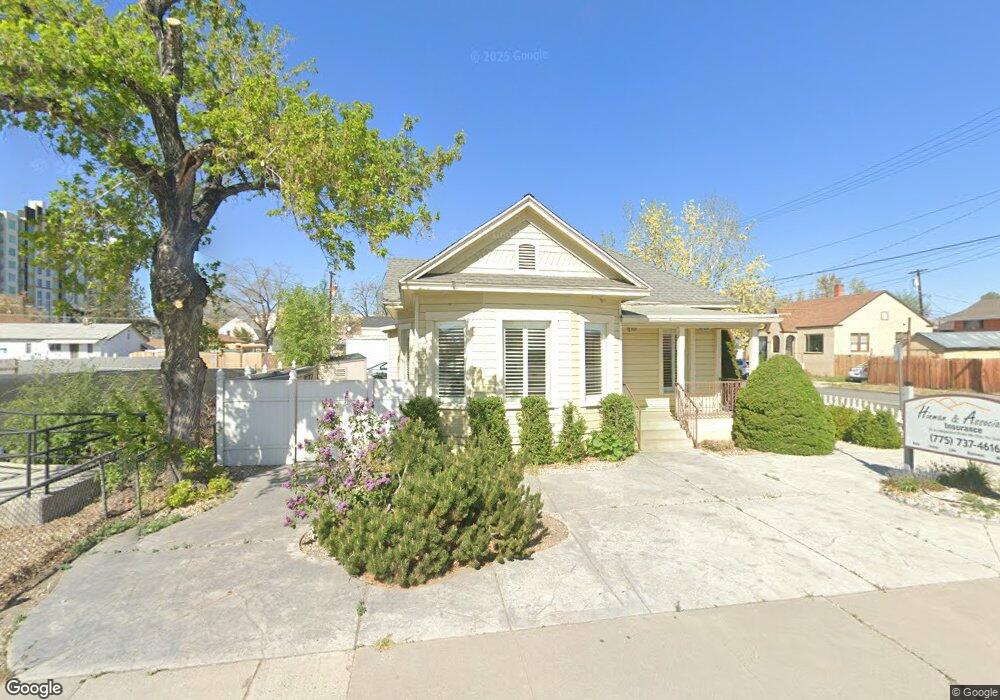
345 Pyramid Way Sparks, NV 89431
Downtown Sparks NeighborhoodEstimated Value: $705,387
2
Beds
1
Bath
1,156
Sq Ft
$610/Sq Ft
Est. Value
About This Home
This home is located at 345 Pyramid Way, Sparks, NV 89431 and is currently estimated at $705,387, approximately $610 per square foot. 345 Pyramid Way is a home located in Washoe County with nearby schools including Robert Mitchell Elementary School, Sparks Middle School, and Sparks High School.
Ownership History
Date
Name
Owned For
Owner Type
Purchase Details
Closed on
Nov 21, 2023
Sold by
Hinman Alexander J
Bought by
Hinman
Current Estimated Value
Purchase Details
Closed on
May 1, 2020
Sold by
Hinman Alexander J
Bought by
Hinman Alexander J and Hinman Wayne E
Purchase Details
Closed on
Oct 17, 2013
Sold by
Andrews John
Bought by
Hinman Alexander J
Purchase Details
Closed on
Dec 22, 2004
Sold by
Andrews John R
Bought by
Andrews John and John Andrews Trust
Purchase Details
Closed on
Aug 4, 2004
Sold by
Andrews Shirley
Bought by
Andrews John R
Home Financials for this Owner
Home Financials are based on the most recent Mortgage that was taken out on this home.
Original Mortgage
$131,250
Interest Rate
6.24%
Mortgage Type
Commercial
Create a Home Valuation Report for This Property
The Home Valuation Report is an in-depth analysis detailing your home's value as well as a comparison with similar homes in the area
Home Values in the Area
Average Home Value in this Area
Purchase History
| Date | Buyer | Sale Price | Title Company |
|---|---|---|---|
| Hinman | -- | None Listed On Document | |
| Hinman Alexander J | $300,000 | None Available | |
| Hinman Alexander J | $270,000 | Western Title Company | |
| Andrews John | -- | -- | |
| Andrews John R | -- | Stewart Title Of Northern Nv |
Source: Public Records
Mortgage History
| Date | Status | Borrower | Loan Amount |
|---|---|---|---|
| Previous Owner | Andrews John R | $131,250 |
Source: Public Records
Tax History Compared to Growth
Tax History
| Year | Tax Paid | Tax Assessment Tax Assessment Total Assessment is a certain percentage of the fair market value that is determined by local assessors to be the total taxable value of land and additions on the property. | Land | Improvement |
|---|---|---|---|---|
| 2025 | $1,771 | $54,182 | $29,518 | $24,665 |
| 2024 | $1,771 | $50,115 | $25,493 | $24,622 |
| 2023 | $1,579 | $46,457 | $25,493 | $20,964 |
| 2022 | $1,462 | $40,972 | $24,151 | $16,821 |
| 2021 | $1,354 | $36,854 | $20,126 | $16,728 |
| 2020 | $1,355 | $36,690 | $20,126 | $16,564 |
| 2019 | $1,329 | $35,973 | $20,126 | $15,847 |
| 2018 | $1,309 | $35,395 | $20,126 | $15,269 |
| 2017 | $1,303 | $35,205 | $20,126 | $15,079 |
| 2016 | $1,303 | $35,524 | $20,126 | $15,398 |
| 2015 | $1,299 | $35,419 | $20,126 | $15,293 |
| 2014 | $1,259 | $34,312 | $20,126 | $14,186 |
| 2013 | -- | $34,035 | $20,126 | $13,909 |
Source: Public Records
Map
Nearby Homes