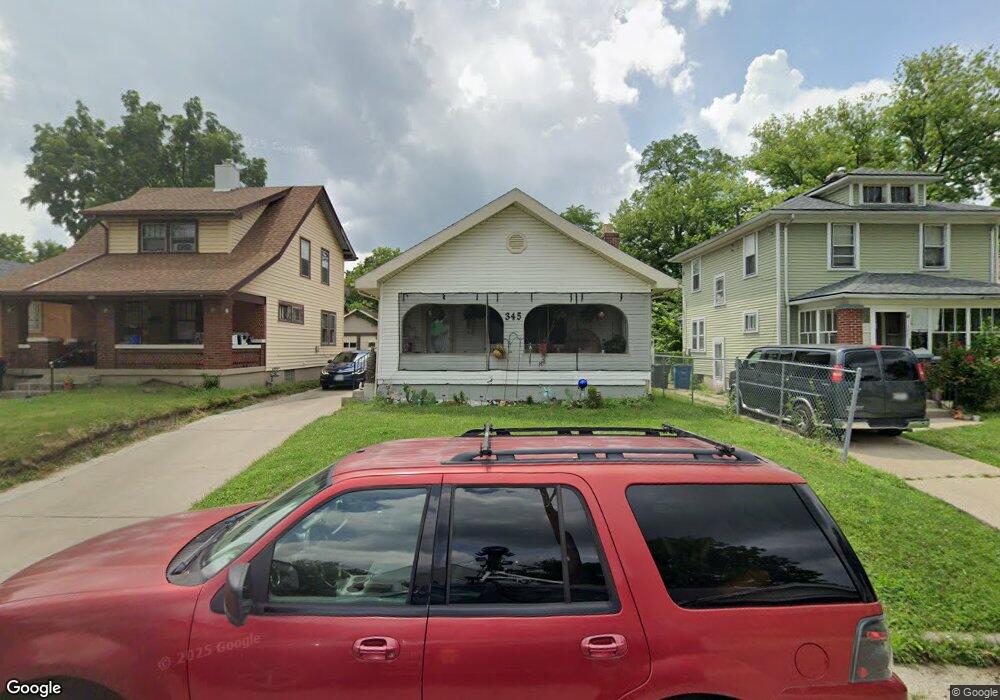
345 Roxbury Rd Dayton, OH 45417
Residence Park NeighborhoodEstimated Value: $94,000 - $116,000
3
Beds
1
Bath
1,262
Sq Ft
$83/Sq Ft
Est. Value
About This Home
This home is located at 345 Roxbury Rd, Dayton, OH 45417 and is currently estimated at $104,457, approximately $82 per square foot. 345 Roxbury Rd is a home located in Montgomery County with nearby schools including International School at Residence Park, Westwood Elementary, and Louise Troy Elementary.
Ownership History
Date
Name
Owned For
Owner Type
Purchase Details
Closed on
Dec 3, 2021
Sold by
Clark Melvin E and Clark Deborah A
Bought by
Johnson Joanne E
Current Estimated Value
Home Financials for this Owner
Home Financials are based on the most recent Mortgage that was taken out on this home.
Original Mortgage
$77,600
Outstanding Balance
$70,940
Interest Rate
3.12%
Mortgage Type
New Conventional
Estimated Equity
$33,517
Purchase Details
Closed on
Sep 11, 2006
Sold by
Washington Clark Deborah A and Clark Deborah A
Bought by
Clark Melvin E and Clark Deborah A
Purchase Details
Closed on
Mar 26, 1997
Sold by
Clark Melvin E and Clark Deborah A
Bought by
Washington Clark Deborah A
Purchase Details
Closed on
Aug 17, 1994
Sold by
Clark Melvin E
Bought by
Clark Deborah A
Purchase Details
Closed on
Jul 26, 1994
Sold by
Clark Deborah A and Washington Deborah A
Bought by
Clark Melvin E
Create a Home Valuation Report for This Property
The Home Valuation Report is an in-depth analysis detailing your home's value as well as a comparison with similar homes in the area
Home Values in the Area
Average Home Value in this Area
Purchase History
| Date | Buyer | Sale Price | Title Company |
|---|---|---|---|
| Johnson Joanne E | $80,000 | Pctitle Pros | |
| Clark Melvin E | -- | None Available | |
| Washington Clark Deborah A | -- | -- | |
| Clark Deborah A | -- | -- | |
| Clark Melvin E | -- | -- |
Source: Public Records
Mortgage History
| Date | Status | Borrower | Loan Amount |
|---|---|---|---|
| Open | Johnson Joanne E | $77,600 |
Source: Public Records
Tax History
| Year | Tax Paid | Tax Assessment Tax Assessment Total Assessment is a certain percentage of the fair market value that is determined by local assessors to be the total taxable value of land and additions on the property. | Land | Improvement |
|---|---|---|---|---|
| 2025 | $262 | $14,000 | $2,210 | $11,790 |
| 2024 | $800 | $14,000 | $2,210 | $11,790 |
| 2023 | $800 | $14,000 | $2,210 | $11,790 |
| 2022 | $780 | $10,550 | $1,660 | $8,890 |
| 2021 | $776 | $10,550 | $1,660 | $8,890 |
| 2020 | $773 | $10,550 | $1,660 | $8,890 |
| 2019 | $882 | $10,800 | $2,080 | $8,720 |
| 2018 | $883 | $10,800 | $2,080 | $8,720 |
| 2017 | $876 | $10,800 | $2,080 | $8,720 |
| 2016 | $919 | $10,800 | $2,080 | $8,720 |
| 2015 | $870 | $10,800 | $2,080 | $8,720 |
| 2014 | $870 | $10,800 | $2,080 | $8,720 |
| 2012 | -- | $14,340 | $2,600 | $11,740 |
Source: Public Records
Map
Nearby Homes
- 4317 Midway Ave
- 425 Elmhurst Rd
- 367 Geneva Rd
- 236 Elmhurst Rd
- 225 Elmhurst Rd
- 4302 Sylvan Dr
- 214 Geneva Rd
- 4519 Alfred Dr
- 419 Lindenwood Rd
- 734 Elmhurst Rd
- 115 Geneva Rd
- 4530 Chesapeake Ave
- 752 Cleverly Rd
- 418 Mia Ave
- 816 N Gettysburg Ave
- 19 S Trenton St
- 148 N Decker Ave
- 734 Tyson Ave
- 504 N Upland Ave
- 72 Patton Ave
- 343 Roxbury Rd
- 349 Roxbury Rd
- 339 Roxbury Rd
- 353 Roxbury Rd
- 333 Roxbury Rd
- 357 Roxbury Rd
- 346 Elmhurst Rd
- 350 Elmhurst Rd
- 329 Roxbury Rd
- 344 Elmhurst Rd
- 354 Elmhurst Rd
- 338 Elmhurst Rd
- 344 Roxbury Rd
- 348 Roxbury Rd
- 325 Roxbury Rd
- 334 Elmhurst Rd
- 340 Roxbury Rd
- 350 Roxbury Rd
- 369 Roxbury Rd
- 336 Roxbury Rd
Your Personal Tour Guide
Ask me questions while you tour the home.