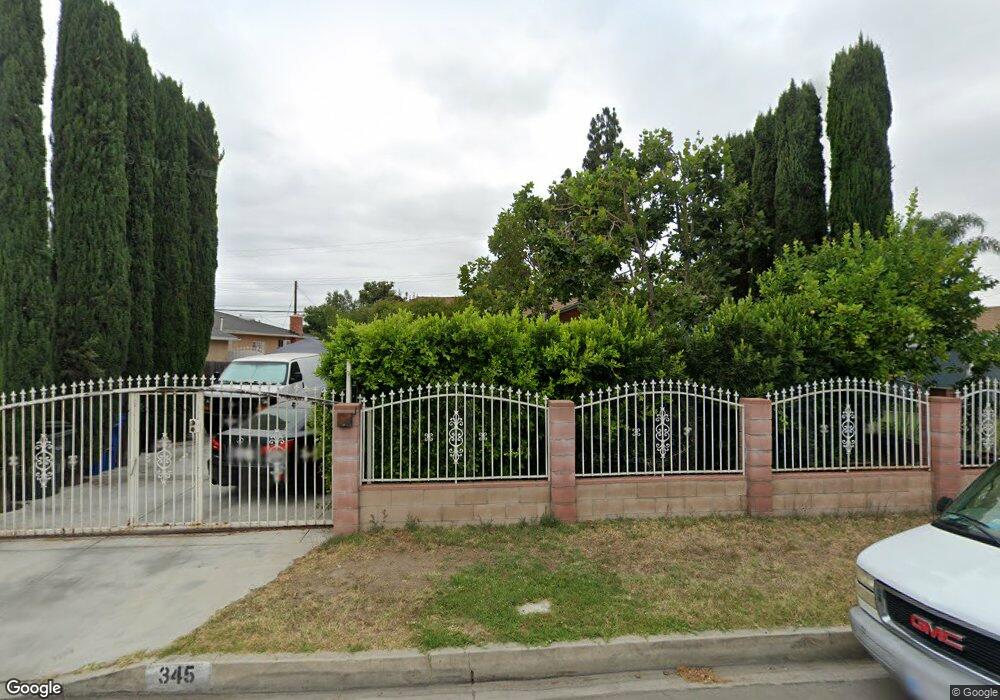
345 Sandia Ave La Puente, CA 91746
Estimated Value: $753,000 - $831,000
4
Beds
3
Baths
1,716
Sq Ft
$465/Sq Ft
Est. Value
About This Home
This home is located at 345 Sandia Ave, La Puente, CA 91746 and is currently estimated at $797,618, approximately $464 per square foot. 345 Sandia Ave is a home located in Los Angeles County with nearby schools including Lassalette Middle School, La Puente High School, and St. Louis of France School.
Ownership History
Date
Name
Owned For
Owner Type
Purchase Details
Closed on
Jun 15, 2004
Sold by
Gutierrez Edward
Bought by
Gutierrez Ricardo
Current Estimated Value
Purchase Details
Closed on
Feb 24, 2003
Sold by
Lizama Gualberto A and Lizama Maria G
Bought by
Gutierrez Edward
Home Financials for this Owner
Home Financials are based on the most recent Mortgage that was taken out on this home.
Original Mortgage
$221,523
Interest Rate
5.93%
Mortgage Type
FHA
Purchase Details
Closed on
Apr 13, 1995
Sold by
Alvarez Abel
Bought by
Lizama Gualberto A and Lizama Maria G
Purchase Details
Closed on
Dec 21, 1993
Sold by
Cisneros Henry G
Bought by
Lizama Gualberto
Home Financials for this Owner
Home Financials are based on the most recent Mortgage that was taken out on this home.
Original Mortgage
$99,750
Interest Rate
7.09%
Create a Home Valuation Report for This Property
The Home Valuation Report is an in-depth analysis detailing your home's value as well as a comparison with similar homes in the area
Home Values in the Area
Average Home Value in this Area
Purchase History
| Date | Buyer | Sale Price | Title Company |
|---|---|---|---|
| Gutierrez Ricardo | -- | -- | |
| Gutierrez Edward | $225,000 | Lawyers Title Company | |
| Lizama Gualberto A | -- | -- | |
| Lizama Gualberto | $105,000 | California Counties Title |
Source: Public Records
Mortgage History
| Date | Status | Borrower | Loan Amount |
|---|---|---|---|
| Previous Owner | Gutierrez Edward | $221,523 | |
| Previous Owner | Lizama Gualberto | $99,750 |
Source: Public Records
Tax History Compared to Growth
Tax History
| Year | Tax Paid | Tax Assessment Tax Assessment Total Assessment is a certain percentage of the fair market value that is determined by local assessors to be the total taxable value of land and additions on the property. | Land | Improvement |
|---|---|---|---|---|
| 2025 | $7,204 | $553,357 | $313,238 | $240,119 |
| 2024 | $6,909 | $542,508 | $307,097 | $235,411 |
| 2023 | $6,735 | $531,872 | $301,076 | $230,796 |
| 2022 | $6,541 | $521,444 | $295,173 | $226,271 |
| 2021 | $5,812 | $411,221 | $289,386 | $121,835 |
| 2020 | $5,189 | $407,005 | $286,419 | $120,586 |
| 2019 | $5,107 | $399,025 | $280,803 | $118,222 |
| 2018 | $4,920 | $391,202 | $275,298 | $115,904 |
| 2016 | $4,565 | $376,012 | $264,608 | $111,404 |
| 2015 | $4,368 | $360,000 | $254,000 | $106,000 |
| 2014 | $4,376 | $360,000 | $254,000 | $106,000 |
Source: Public Records
Map
Nearby Homes
- 433 Sunkist Ave
- 544 N Orange Ave Unit B
- 452 Willow Ave
- 335 Willow Ave
- 13903 Moccasin St
- 610 Willow Ave
- 736 Tonopah Ave
- 227 S 4th Ave
- 320 S 5th Ave
- 14421 Flynn St
- 14612 Hutchcroft St
- 13622 Hartsville St
- 338 S 4th Ave
- 14510 Amar Rd Unit J
- 421 S 5th Ave
- 750 Glenshaw Dr
- 13426 Austen Way
- 979 Willow Ave Unit 31
- 943 Willow Ave
- 14940 Beckner St
- 339 Sandia Ave
- 349 Sandia Ave
- 14228 Las Vecinas Dr
- 333 Sandia Ave
- 353 Sandia Ave
- 329 Sandia Ave
- 403 Sandia Ave
- 14220 Las Vecinas Dr
- 14225 Flagstaff St
- 14229 Las Vecinas Dr
- 342 Sandia Ave
- 348 Sandia Ave
- 338 Sandia Ave
- 352 Sandia Ave
- 14221 Las Vecinas Dr
- 334 Sandia Ave
- 409 Sandia Ave
- 323 Sandia Ave
- 14214 Las Vecinas Dr
- 14217 Flagstaff St