345 Willard Rd Ardmore, OK 73401
Estimated Value: $205,000 - $301,000
3
Beds
2
Baths
1,485
Sq Ft
$171/Sq Ft
Est. Value
About This Home
This home is located at 345 Willard Rd, Ardmore, OK 73401 and is currently estimated at $253,346, approximately $170 per square foot. 345 Willard Rd is a home located in Carter County with nearby schools including Dickson Elementary School, Dickson Upper Elementary School, and Dickson Middle School.
Ownership History
Date
Name
Owned For
Owner Type
Purchase Details
Closed on
Sep 16, 2025
Sold by
Preston Carrol D and Preston Deborah J
Bought by
Carrol And Deborah Preston Family Trust and Preston
Current Estimated Value
Purchase Details
Closed on
Jul 31, 2012
Sold by
Welch Linda L and Browne Linda L
Bought by
Preston Carrol D and Preston Deborah J
Home Financials for this Owner
Home Financials are based on the most recent Mortgage that was taken out on this home.
Original Mortgage
$114,835
Interest Rate
3.63%
Mortgage Type
New Conventional
Purchase Details
Closed on
Jun 28, 1998
Sold by
Welch Raymond J and Welch Lin
Bought by
Welch Linda
Purchase Details
Closed on
Jun 26, 1998
Sold by
Welch Linda
Bought by
Browne Christopher and Browne L
Create a Home Valuation Report for This Property
The Home Valuation Report is an in-depth analysis detailing your home's value as well as a comparison with similar homes in the area
Home Values in the Area
Average Home Value in this Area
Purchase History
| Date | Buyer | Sale Price | Title Company |
|---|---|---|---|
| Carrol And Deborah Preston Family Trust | -- | None Listed On Document | |
| Carrol And Deborah Preston Family Trust | -- | None Listed On Document | |
| Preston Carrol D | $125,333 | None Available | |
| Welch Linda | -- | -- | |
| Browne Christopher | -- | -- |
Source: Public Records
Mortgage History
| Date | Status | Borrower | Loan Amount |
|---|---|---|---|
| Previous Owner | Preston Carrol D | $114,835 |
Source: Public Records
Tax History Compared to Growth
Tax History
| Year | Tax Paid | Tax Assessment Tax Assessment Total Assessment is a certain percentage of the fair market value that is determined by local assessors to be the total taxable value of land and additions on the property. | Land | Improvement |
|---|---|---|---|---|
| 2025 | $1,536 | $16,005 | $1,238 | $14,767 |
| 2024 | $1,536 | $15,539 | $1,238 | $14,301 |
| 2023 | $1,481 | $15,087 | $1,238 | $13,849 |
| 2022 | $1,345 | $14,647 | $1,238 | $13,409 |
| 2021 | $1,338 | $14,221 | $2,088 | $12,133 |
| 2020 | $1,318 | $14,221 | $2,088 | $12,133 |
| 2019 | $1,248 | $13,933 | $2,088 | $11,845 |
| 2018 | $1,225 | $13,527 | $2,088 | $11,439 |
| 2017 | $1,285 | $12,884 | $2,088 | $10,796 |
| 2016 | $1,201 | $12,270 | $2,088 | $10,182 |
| 2015 | $1,212 | $12,356 | $348 | $12,008 |
| 2014 | $1,298 | $13,228 | $348 | $12,880 |
Source: Public Records
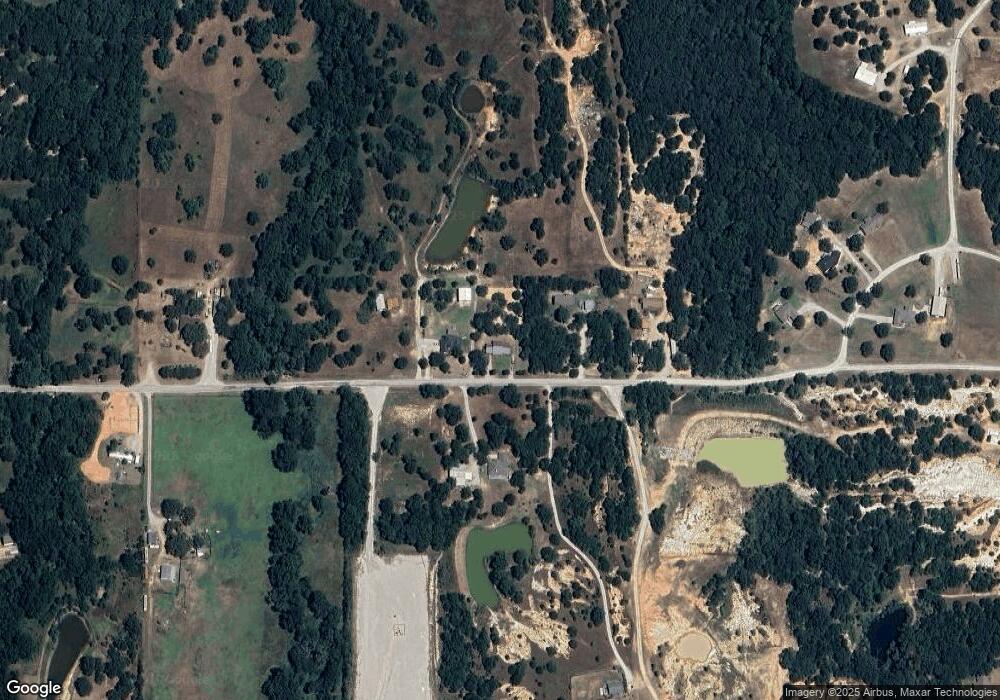
Map
Nearby Homes
- 6296 Dickson Rd
- 0 Highway 199
- 64 Crescent Ln
- 3419 State Highway 199
- 3484 State Highway 199
- 3376 Old Highway 70
- 3376 Old Hwy 70
- 4673 Highway 199
- 4695 Highway 199
- 268 Birch Rd
- 13 Titan Dr
- 2 Titan Dr
- 1 Titan Dr
- 24243 Tiny Chapel Rd
- 6389 Oklahoma 199
- 1114 Comet Rd
- 237 Killarney Dr
- 54 Pecan St
- 6 Grandview Rd
- 3 Grandview Rd
- 311 Willard Rd
- 387 Willard Rd
- 299 Willard Rd
- 324 Willard Rd
- 441 Willard Rd
- 420 Willard Rd
- 000 Willard Rd
- 376 Willard Rd
- 167 Willard Rd
- 208 Woodview Dr
- 156 Woodview Dr
- 150 Woodview Dr
- 191 Woodview Dr
- 176 Willard Rd
- 119 Northside Dr
- 0 Woodview Dr
- 693 Pinewood Trails Dr
- 7052 Dickson Rd
- 6884 Dickson Rd
- 246 Country Hill Rd