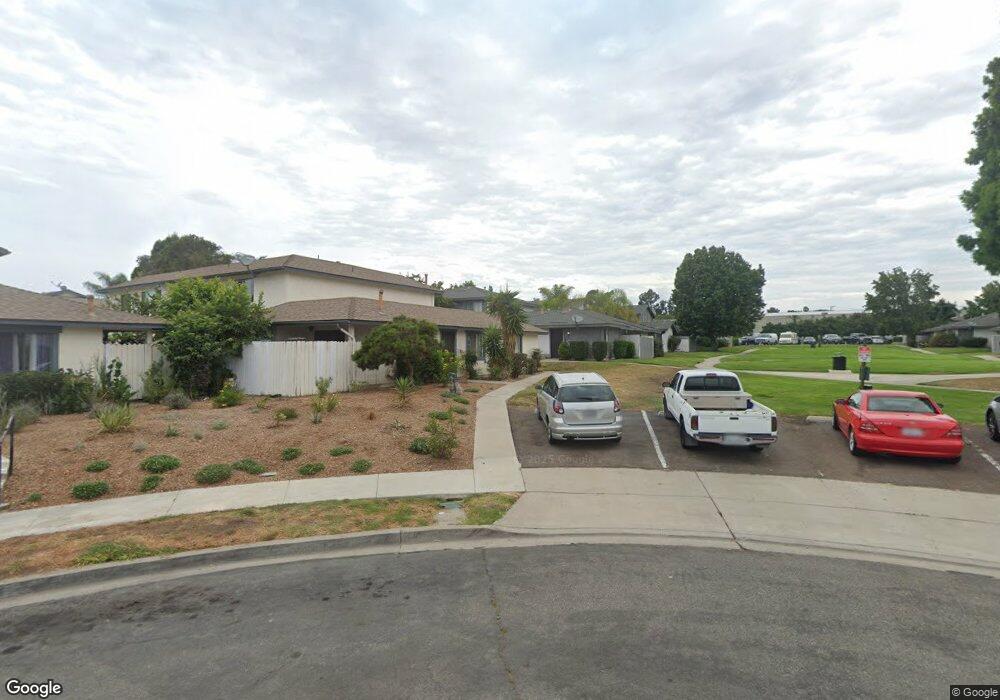
3451 Seabreeze Walk Oceanside, CA 92056
Lake NeighborhoodEstimated Value: $412,459 - $463,000
2
Beds
1
Bath
807
Sq Ft
$536/Sq Ft
Est. Value
About This Home
This home is located at 3451 Seabreeze Walk, Oceanside, CA 92056 and is currently estimated at $432,486, approximately $535 per square foot. 3451 Seabreeze Walk is a home located in San Diego County with nearby schools including Calavera Hills Elementary, Calavera Hills Middle, and Sage Creek High.
Ownership History
Date
Name
Owned For
Owner Type
Purchase Details
Closed on
Nov 3, 2008
Sold by
Wells Fargo Bank National Association
Bought by
Loftus Damian J
Current Estimated Value
Purchase Details
Closed on
May 16, 2008
Sold by
Lowe Dean A
Bought by
Wells Fargo Bank Na
Purchase Details
Closed on
Jun 21, 2001
Sold by
Wencek Philip J
Bought by
Lowe Dean A
Home Financials for this Owner
Home Financials are based on the most recent Mortgage that was taken out on this home.
Original Mortgage
$84,000
Interest Rate
9.12%
Purchase Details
Closed on
Jun 20, 2001
Sold by
Wencek Phyllis C
Bought by
Wencek Philip J
Home Financials for this Owner
Home Financials are based on the most recent Mortgage that was taken out on this home.
Original Mortgage
$84,000
Interest Rate
9.12%
Purchase Details
Closed on
Aug 31, 1990
Create a Home Valuation Report for This Property
The Home Valuation Report is an in-depth analysis detailing your home's value as well as a comparison with similar homes in the area
Home Values in the Area
Average Home Value in this Area
Purchase History
| Date | Buyer | Sale Price | Title Company |
|---|---|---|---|
| Loftus Damian J | $78,000 | Lsi Title Company | |
| Wells Fargo Bank Na | $102,895 | National Title Ins Co Of Ny | |
| Lowe Dean A | $105,000 | Commonwealth Land Title Co | |
| Wencek Philip J | -- | Commonwealth Land Title Co | |
| -- | $76,000 | -- |
Source: Public Records
Mortgage History
| Date | Status | Borrower | Loan Amount |
|---|---|---|---|
| Previous Owner | Lowe Dean A | $84,000 | |
| Previous Owner | Wencek Philip J | $21,000 |
Source: Public Records
Tax History
| Year | Tax Paid | Tax Assessment Tax Assessment Total Assessment is a certain percentage of the fair market value that is determined by local assessors to be the total taxable value of land and additions on the property. | Land | Improvement |
|---|---|---|---|---|
| 2025 | $1,091 | $100,428 | $61,805 | $38,623 |
| 2024 | $1,091 | $98,460 | $60,594 | $37,866 |
| 2023 | $1,084 | $96,530 | $59,406 | $37,124 |
| 2022 | $1,068 | $94,639 | $58,242 | $36,397 |
| 2021 | $1,060 | $92,784 | $57,100 | $35,684 |
| 2020 | $1,053 | $91,834 | $56,515 | $35,319 |
| 2019 | $1,035 | $90,034 | $55,407 | $34,627 |
| 2018 | $992 | $88,270 | $54,321 | $33,949 |
| 2017 | $976 | $86,540 | $53,256 | $33,284 |
| 2016 | $937 | $84,844 | $52,212 | $32,632 |
| 2015 | $933 | $83,570 | $51,428 | $32,142 |
| 2014 | $919 | $81,934 | $50,421 | $31,513 |
Source: Public Records
Map
Nearby Homes
- 3522 Thunder Dr
- 3472 Thunder Dr Unit 8A
- 3466 Thunder Dr
- 3454 Thunder Dr
- 3458 Thunder Dr
- 3456 Thunder Dr
- 3448 Seabreeze Walk
- 3434 Seabreeze Walk
- 3422 Seabreeze Walk Unit 20A
- 3424 Del Este Way Unit 52B
- 2130 Sunset Dr Unit 55
- 2130 Sunset Dr Unit 134
- 2130 Sunset Dr Unit 70
- 2130 Sunset Dr Unit 69
- 2130 Sunset Dr Unit 14
- 2130 Sunset Dr Unit 135
- 3579 Twilight Ln
- 3477 N Sundown Ln
- 4231 Cielo Ave
- 3545 Knollwood Dr
- 3457 Seabreeze Walk
- 3455 Seabreeze Walk Unit 11C
- 3453 Seabreeze Walk
- 3467 Seabreeze Walk
- 3465 Seabreeze Walk
- 3463 Seabreeze Walk
- 3461 Seabreeze Walk
- 3443 Seabreeze Walk
- 3441 Seabreeze Walk Unit 12A
- 3447 Seabreeze Walk
- 3445 Seabreeze Walk
- 3477 Seabreeze Walk
- 3473 Seabreeze Walk
- 3471 Seabreeze Walk
- 3475 Seabreeze Walk
- 3435 Seabreeze Walk
- 3437 Seabreeze Walk
- 3433 Seabreeze Walk
- 3431 Seabreeze Walk
- 3452 Thunder Dr
Your Personal Tour Guide
Ask me questions while you tour the home.