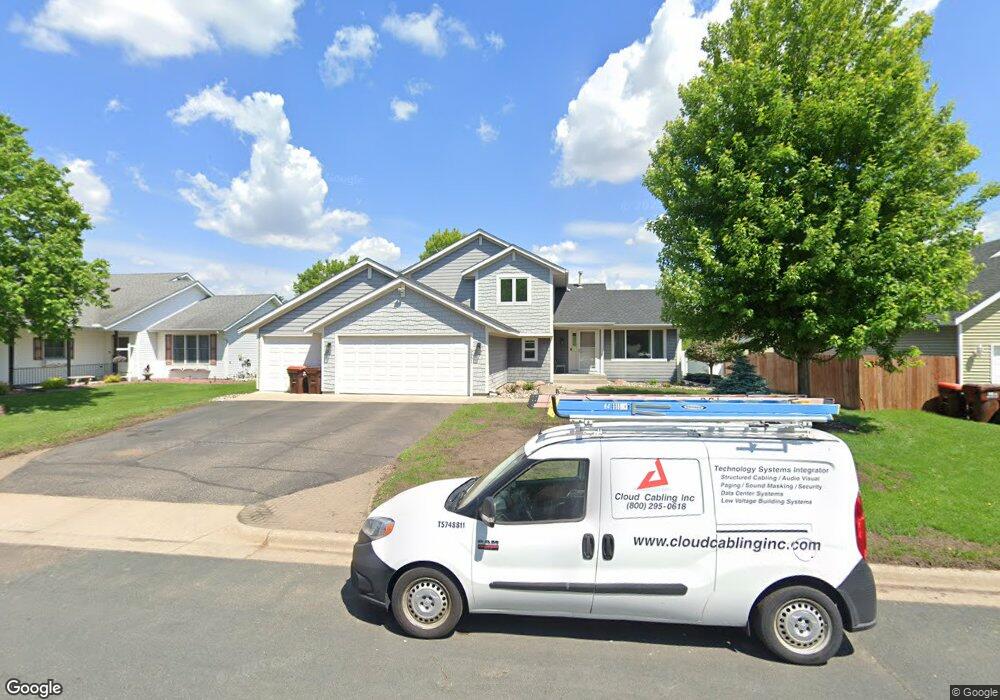
3451 Vista Ct Hastings, MN 55033
Hastings-Marshan Township NeighborhoodEstimated Value: $423,540 - $508,000
3
Beds
3
Baths
1,186
Sq Ft
$388/Sq Ft
Est. Value
About This Home
This home is located at 3451 Vista Ct, Hastings, MN 55033 and is currently estimated at $460,135, approximately $387 per square foot. 3451 Vista Ct is a home located in Dakota County with nearby schools including Hastings Middle School, Christa Mcauliffe Elementary School, and Hastings High School.
Ownership History
Date
Name
Owned For
Owner Type
Purchase Details
Closed on
Nov 11, 2016
Sold by
Anderson David and Anderson Breanne
Bought by
Carl Jeremy L and Bettis Ashley R
Current Estimated Value
Home Financials for this Owner
Home Financials are based on the most recent Mortgage that was taken out on this home.
Original Mortgage
$258,953
Outstanding Balance
$206,772
Interest Rate
3.25%
Mortgage Type
FHA
Estimated Equity
$253,363
Purchase Details
Closed on
Apr 27, 2007
Sold by
Reissner Tracy L and Reissner Jeffrey D
Bought by
Anderson Breanne and Anderson David
Purchase Details
Closed on
May 28, 1999
Sold by
Barnett Lawrence A and Barnett Karen D
Bought by
Reissner Jeffrey D and Reissner Tracy L
Purchase Details
Closed on
Oct 24, 1996
Sold by
Jablonske Gregory A and Jablonske Susan M
Bought by
Barnett Lawrence A and Barnett Karen D
Purchase Details
Closed on
Jul 23, 1996
Sold by
Advanced Homes Of Hastings Inc
Bought by
Jablonske Gregory A
Create a Home Valuation Report for This Property
The Home Valuation Report is an in-depth analysis detailing your home's value as well as a comparison with similar homes in the area
Home Values in the Area
Average Home Value in this Area
Purchase History
| Date | Buyer | Sale Price | Title Company |
|---|---|---|---|
| Carl Jeremy L | $274,500 | Dca Title | |
| Anderson Breanne | $238,900 | -- | |
| Reissner Jeffrey D | $171,000 | -- | |
| Barnett Lawrence A | $155,635 | -- | |
| Jablonske Gregory A | $20,600 | -- |
Source: Public Records
Mortgage History
| Date | Status | Borrower | Loan Amount |
|---|---|---|---|
| Open | Carl Jeremy L | $258,953 |
Source: Public Records
Tax History Compared to Growth
Tax History
| Year | Tax Paid | Tax Assessment Tax Assessment Total Assessment is a certain percentage of the fair market value that is determined by local assessors to be the total taxable value of land and additions on the property. | Land | Improvement |
|---|---|---|---|---|
| 2024 | $4,480 | $399,200 | $74,300 | $324,900 |
| 2023 | $4,480 | $389,700 | $73,000 | $316,700 |
| 2022 | $3,666 | $371,800 | $72,800 | $299,000 |
| 2021 | $3,874 | $305,700 | $63,300 | $242,400 |
| 2020 | $3,660 | $319,300 | $60,300 | $259,000 |
| 2019 | $3,607 | $293,900 | $57,500 | $236,400 |
| 2018 | $3,295 | $276,600 | $53,200 | $223,400 |
| 2017 | $3,216 | $247,400 | $50,700 | $196,700 |
| 2016 | $3,244 | $241,300 | $47,300 | $194,000 |
| 2015 | $3,032 | $224,600 | $45,900 | $178,700 |
| 2014 | -- | $211,100 | $44,300 | $166,800 |
| 2013 | -- | $190,900 | $40,000 | $150,900 |
Source: Public Records
Map
Nearby Homes
- 1163 Teal Way
- 3125 Village Trail Unit 217
- 753 Greten Ln
- 782 31st St W
- 664 35th St W
- 1780 River Shore Dr
- 1595 River Shore Dr
- 365 Hayes Dr Unit 30
- 2309 Old Bridge Ln
- 2310 Old Bridge Ln
- 379 Frederick Cir Unit 905
- Promenade III Plan at Villas at Pleasant
- 2289 Old Bridge Ln
- Portico Plan at Villas at Pleasant
- Palazzo Plan at Villas at Pleasant
- 2021 Pine St
- 1730 River Shore Dr
- 2280 Old Bridge Ln
- 1634 River Shore Dr
- 313 Frederick Cir Unit 106