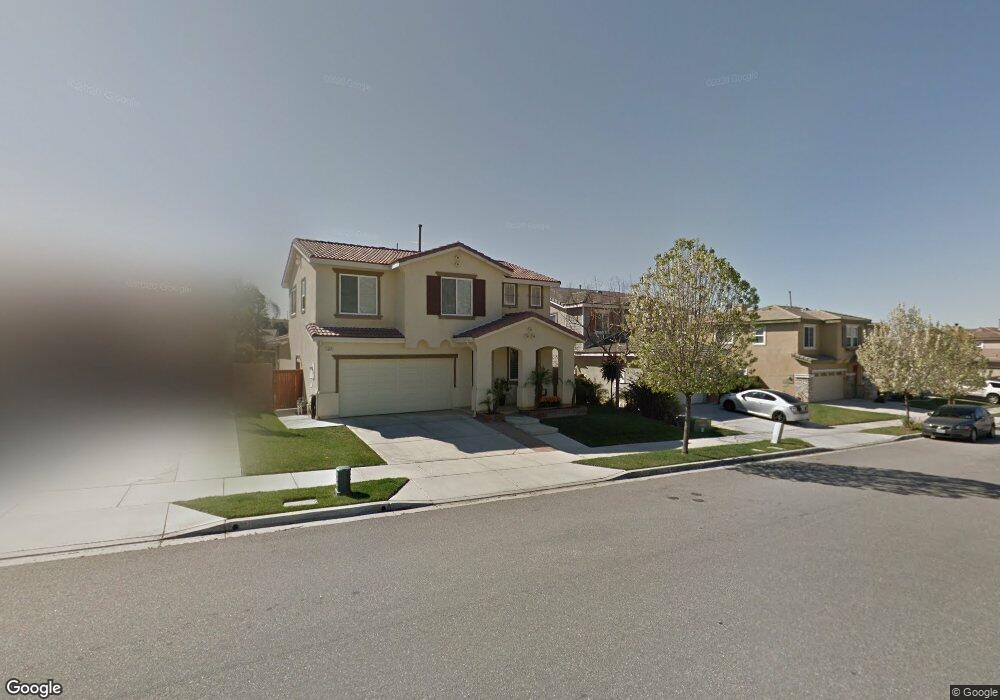
34515 Princeton Dr Yucaipa, CA 92399
Estimated Value: $573,675 - $654,000
4
Beds
2
Baths
2,259
Sq Ft
$277/Sq Ft
Est. Value
About This Home
This home is located at 34515 Princeton Dr, Yucaipa, CA 92399 and is currently estimated at $625,669, approximately $276 per square foot. 34515 Princeton Dr is a home located in San Bernardino County with nearby schools including Chapman Heights Elementary, Park View Middle School, and Yucaipa High School.
Ownership History
Date
Name
Owned For
Owner Type
Purchase Details
Closed on
Mar 13, 2012
Sold by
Alford Timothy Philip and Alford Jill Marie
Bought by
Alford Tim and Alford Jill
Current Estimated Value
Home Financials for this Owner
Home Financials are based on the most recent Mortgage that was taken out on this home.
Original Mortgage
$214,500
Outstanding Balance
$147,065
Interest Rate
3.83%
Mortgage Type
New Conventional
Estimated Equity
$478,604
Purchase Details
Closed on
Aug 28, 2008
Sold by
Alford Tim and Alford Jill
Bought by
Alford Tim and Alford Jill
Purchase Details
Closed on
Jul 19, 2004
Sold by
Swc Yp2 110 Llc
Bought by
Alford Tim P and Alford Jill M
Home Financials for this Owner
Home Financials are based on the most recent Mortgage that was taken out on this home.
Original Mortgage
$231,900
Interest Rate
6.24%
Mortgage Type
Purchase Money Mortgage
Create a Home Valuation Report for This Property
The Home Valuation Report is an in-depth analysis detailing your home's value as well as a comparison with similar homes in the area
Home Values in the Area
Average Home Value in this Area
Purchase History
| Date | Buyer | Sale Price | Title Company |
|---|---|---|---|
| Alford Tim | -- | Stewart Title | |
| Alford Timothy Philip | -- | Stewart Title Of The Inland | |
| Alford Tim | -- | None Available | |
| Alford Tim P | $290,000 | Lawyers Title Company |
Source: Public Records
Mortgage History
| Date | Status | Borrower | Loan Amount |
|---|---|---|---|
| Open | Alford Timothy Philip | $214,500 | |
| Closed | Alford Tim P | $231,900 |
Source: Public Records
Tax History Compared to Growth
Tax History
| Year | Tax Paid | Tax Assessment Tax Assessment Total Assessment is a certain percentage of the fair market value that is determined by local assessors to be the total taxable value of land and additions on the property. | Land | Improvement |
|---|---|---|---|---|
| 2025 | $5,166 | $314,014 | $94,203 | $219,811 |
| 2024 | $5,166 | $307,857 | $92,356 | $215,501 |
| 2023 | $5,188 | $301,820 | $90,545 | $211,275 |
| 2022 | $5,222 | $295,902 | $88,770 | $207,132 |
| 2021 | $5,104 | $290,100 | $87,029 | $203,071 |
| 2020 | $5,137 | $287,126 | $86,137 | $200,989 |
| 2019 | $5,029 | $281,496 | $84,448 | $197,048 |
| 2018 | $4,614 | $275,976 | $82,792 | $193,184 |
| 2017 | $4,541 | $270,565 | $81,169 | $189,396 |
| 2016 | $4,531 | $265,259 | $79,577 | $185,682 |
| 2015 | $4,526 | $261,275 | $78,382 | $182,893 |
| 2014 | $4,215 | $256,157 | $76,847 | $179,310 |
Source: Public Records
Map
Nearby Homes
- 34492 Yale Dr
- 34458 Princeton Dr
- 34684 Yale Dr
- 34440 Fawn Ridge Place
- 34280 Forest Oaks Dr
- 11537 Deerfield Dr
- 11870 3rd St
- 11987 Peach Tree Rd
- 34350 Cedar Ave
- 34113 Castle Pines Dr
- 12035 3rd St
- 34177 Pinehurst Dr
- 34942 S Serrano Square
- 34107 Lake Breeze Dr
- 11692 Bluegrass Rd
- 34900 N Serrano Square
- 11452 Pinon Trail
- 11811 Cramer Rd
- 12177 3rd St Unit 8
- 12177 3rd St Unit 10
- 34521 Princeton Dr
- 34505 Princeton Dr
- 34493 Princeton Dr
- 11618 Cornell Cir
- 34483 Princeton Dr
- 34537 Princeton Dr
- 11619 Cornell Cir
- 34512 Yale Dr
- 34473 Princeton Dr
- 34545 Princeton Dr
- 11613 Cornell Cir
- 11612 Cornell Cir
- 11606 Cornell Cir
- 34482 Princeton Dr
- 34516 Yale Dr
- 11607 Cornell Cir
- 11600 Cornell Cir
- 34553 Princeton Dr
- 34469 Princeton Dr
- 11606 Townsend Way