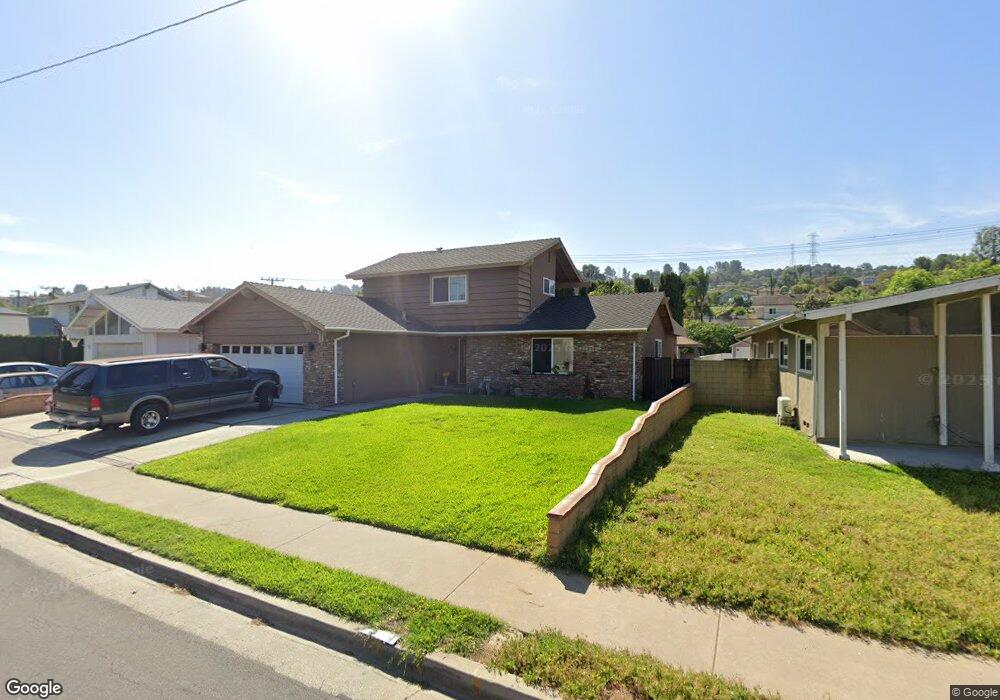
3452 Castle Rock Rd Diamond Bar, CA 91765
Estimated Value: $1,112,533 - $1,193,000
5
Beds
2
Baths
2,048
Sq Ft
$570/Sq Ft
Est. Value
About This Home
This home is located at 3452 Castle Rock Rd, Diamond Bar, CA 91765 and is currently estimated at $1,166,383, approximately $569 per square foot. 3452 Castle Rock Rd is a home located in Los Angeles County with nearby schools including Castle Rock Elementary School, South Pointe Middle School, and Diamond Bar High School.
Ownership History
Date
Name
Owned For
Owner Type
Purchase Details
Closed on
Dec 6, 2017
Sold by
Trinh Thinh Duc and Trinh Annmarie
Bought by
Trinh Thinh Duc and Trinh Annmarie
Current Estimated Value
Purchase Details
Closed on
May 5, 1999
Sold by
Trinh Thinh Doc and Trinh Annmarie
Bought by
Trinh Thinh Duc and Trinh Annmarie
Home Financials for this Owner
Home Financials are based on the most recent Mortgage that was taken out on this home.
Original Mortgage
$168,000
Outstanding Balance
$43,049
Interest Rate
6.94%
Estimated Equity
$1,123,334
Purchase Details
Closed on
May 14, 1997
Sold by
Bower William L and Bower Susan A
Bought by
Trinh Thinh Duc and Trinh Ann Marie
Home Financials for this Owner
Home Financials are based on the most recent Mortgage that was taken out on this home.
Original Mortgage
$161,100
Interest Rate
7.83%
Create a Home Valuation Report for This Property
The Home Valuation Report is an in-depth analysis detailing your home's value as well as a comparison with similar homes in the area
Home Values in the Area
Average Home Value in this Area
Purchase History
| Date | Buyer | Sale Price | Title Company |
|---|---|---|---|
| Trinh Thinh Duc | -- | None Available | |
| Trinh Thinh Duc | -- | -- | |
| Trinh Thinh Duc | $179,000 | -- |
Source: Public Records
Mortgage History
| Date | Status | Borrower | Loan Amount |
|---|---|---|---|
| Open | Trinh Thinh Duc | $168,000 | |
| Previous Owner | Trinh Thinh Duc | $161,100 |
Source: Public Records
Tax History Compared to Growth
Tax History
| Year | Tax Paid | Tax Assessment Tax Assessment Total Assessment is a certain percentage of the fair market value that is determined by local assessors to be the total taxable value of land and additions on the property. | Land | Improvement |
|---|---|---|---|---|
| 2025 | $4,112 | $305,465 | $132,602 | $172,863 |
| 2024 | $4,112 | $299,476 | $130,002 | $169,474 |
| 2023 | $3,970 | $293,604 | $127,453 | $166,151 |
| 2022 | $3,886 | $287,848 | $124,954 | $162,894 |
| 2021 | $3,805 | $282,204 | $122,504 | $159,700 |
| 2019 | $3,688 | $273,835 | $118,871 | $154,964 |
| 2018 | $3,498 | $268,467 | $116,541 | $151,926 |
| 2016 | $3,234 | $258,044 | $112,016 | $146,028 |
| 2015 | $3,249 | $254,169 | $110,334 | $143,835 |
| 2014 | $3,256 | $249,191 | $108,173 | $141,018 |
Source: Public Records
Map
Nearby Homes
- 3135 Marigold Cir
- 3201 Marigold Cir
- 3702 Crooked Creek Dr
- 21187 Ambushers St
- 20610 E Oak Meadow Ln
- 20905 Running Branch Rd
- 21307 Chirping Sparrow Rd
- 2968 Crooked Creek Dr
- 21128 Trigger Ln
- 2905 Yucatan Place Unit A
- 2990 Malaga Cir Unit C
- 20374 Portside Dr
- 3005 La Paz Ln Unit C
- 20834 E Boulder Ln
- 2945 Steeplechase Ln
- 3145 Steeplechase Ln
- 2710 Castle Rock Rd
- 2614 S Quarry Ln Unit A
- 2831 Steeplechase Ln
- 20725 E Crest Ln Unit D
- 3458 Castle Rock Rd
- 3446 Castle Rock Rd
- 3466 Castle Rock Rd
- 3440 Castle Rock Rd
- 3473 Castle Rock Rd
- 3453 Castle Rock Rd
- 3449 Castle Rock Rd
- 3459 Castle Rock Rd
- 3449 Crooked Creek Dr
- 3474 Castle Rock Rd
- 3503 Crooked Creek Dr
- 3434 Castle Rock Rd
- 3443 Castle Rock Rd
- 3443 Crooked Creek Dr
- 3465 Castle Rock Rd
- 3509 Crooked Creek Dr
- 3437 Crooked Creek Dr
- 3435 Castle Rock Rd
- 3471 Castle Rock Rd
- 3480 Castle Rock Rd