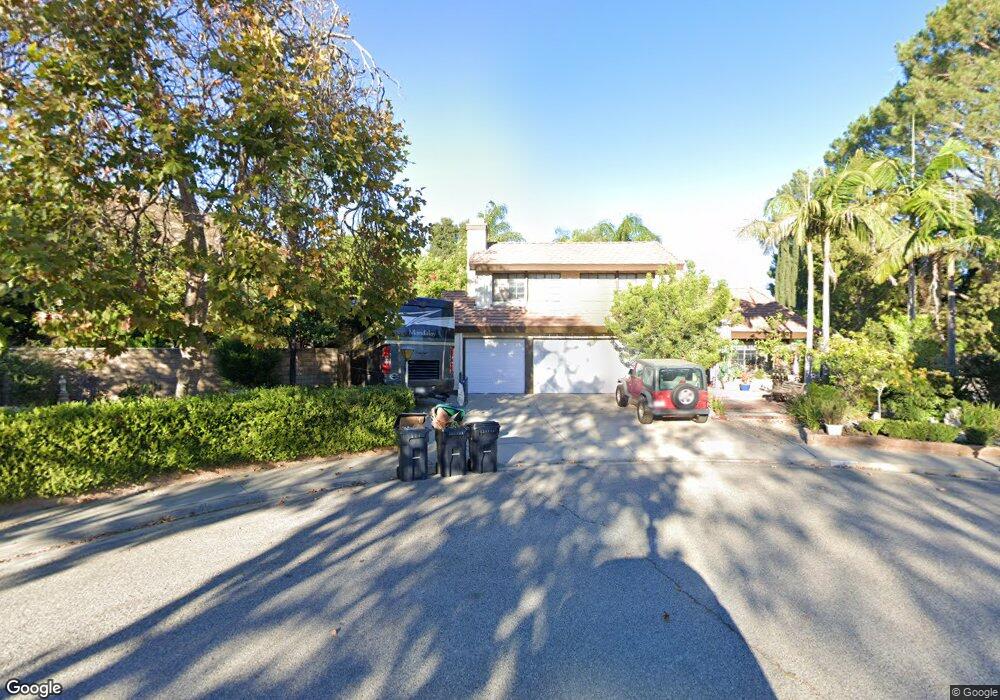
3453 Presidio Ct Simi Valley, CA 93063
Central Simi Valley NeighborhoodEstimated Value: $988,000 - $1,204,000
5
Beds
3
Baths
2,523
Sq Ft
$430/Sq Ft
Est. Value
About This Home
This home is located at 3453 Presidio Ct, Simi Valley, CA 93063 and is currently estimated at $1,083,681, approximately $429 per square foot. 3453 Presidio Ct is a home located in Ventura County with nearby schools including Township Elementary School, Valley View Middle School, and Simi Valley High School.
Ownership History
Date
Name
Owned For
Owner Type
Purchase Details
Closed on
Apr 1, 2015
Sold by
Le Khai Q and Le My Linh T
Bought by
Vo Le Family Trust and Le My Linh T
Current Estimated Value
Purchase Details
Closed on
Jun 25, 2014
Sold by
Le Khai Q and Le My Linh T
Bought by
Le Khai Q and Le My Linh T
Purchase Details
Closed on
Mar 24, 2008
Sold by
Vu Tuyet Anh
Bought by
Vo Giang T
Home Financials for this Owner
Home Financials are based on the most recent Mortgage that was taken out on this home.
Original Mortgage
$250,000
Interest Rate
5.23%
Mortgage Type
New Conventional
Purchase Details
Closed on
Feb 16, 2006
Sold by
Le Khai Q and Le My Linh T
Bought by
Le Khai Q and Le My Linh T
Purchase Details
Closed on
Apr 26, 2002
Sold by
Le Khai Q and Le My Linh T
Bought by
Le Khai Q and Le My Linh T
Create a Home Valuation Report for This Property
The Home Valuation Report is an in-depth analysis detailing your home's value as well as a comparison with similar homes in the area
Home Values in the Area
Average Home Value in this Area
Purchase History
| Date | Buyer | Sale Price | Title Company |
|---|---|---|---|
| Vo Le Family Trust | -- | None Available | |
| Le Khai Q | -- | None Available | |
| Vo Giang T | -- | Lsi | |
| Le Khai Q | -- | None Available | |
| Le Khai Q | -- | First American Title Ins Co |
Source: Public Records
Mortgage History
| Date | Status | Borrower | Loan Amount |
|---|---|---|---|
| Closed | Vo Giang T | $250,000 |
Source: Public Records
Tax History
| Year | Tax Paid | Tax Assessment Tax Assessment Total Assessment is a certain percentage of the fair market value that is determined by local assessors to be the total taxable value of land and additions on the property. | Land | Improvement |
|---|---|---|---|---|
| 2025 | $4,700 | $352,864 | $123,492 | $229,372 |
| 2024 | $4,700 | $345,946 | $121,071 | $224,875 |
| 2023 | $4,429 | $339,163 | $118,697 | $220,466 |
| 2022 | $4,397 | $332,513 | $116,369 | $216,144 |
| 2021 | $4,354 | $325,994 | $114,088 | $211,906 |
| 2020 | $4,259 | $322,653 | $112,919 | $209,734 |
| 2019 | $4,071 | $316,327 | $110,705 | $205,622 |
| 2018 | $4,030 | $310,126 | $108,535 | $201,591 |
| 2017 | $3,937 | $304,046 | $106,407 | $197,639 |
| 2016 | $3,766 | $298,085 | $104,321 | $193,764 |
| 2015 | $3,684 | $293,609 | $102,755 | $190,854 |
| 2014 | $3,626 | $287,860 | $100,744 | $187,116 |
Source: Public Records
Map
Nearby Homes
- 3477 Vicki Ct
- 3319 Township Ave
- 3259 Valarie Ave
- 3330 Township Ave
- 3307 Cole Ave
- 3039 Country Ln
- 3279 Avenida Simi
- 6505 Canyon Oaks Dr
- 2972 Ivory Ave
- 2746 Lemon Dr
- 2707 Bitternut Cir
- 3562 Quincy Ave
- 2727 Reservoir Dr
- 2696 Santa Ynez Ave
- 3445 Highwood Ct Unit 128
- 3403 Highwood Ct Unit 154
- 3474 Highwood Ct Unit 80
- 3434 Highwood Ct Unit 183
- 3458 Highwood Ct Unit 198
- 2413 Lita Place
Your Personal Tour Guide
Ask me questions while you tour the home.