34538 Timber Ridge Rd Shingletown, CA 96088
Estimated Value: $289,000 - $394,000
3
Beds
2
Baths
1,690
Sq Ft
$202/Sq Ft
Est. Value
About This Home
This home is located at 34538 Timber Ridge Rd, Shingletown, CA 96088 and is currently estimated at $341,531, approximately $202 per square foot. 34538 Timber Ridge Rd is a home located in Shasta County with nearby schools including Black Butte Elementary School, Black Butte Junior High School, and Foothill High School.
Ownership History
Date
Name
Owned For
Owner Type
Purchase Details
Closed on
Aug 27, 2009
Sold by
Benson Nancy J
Bought by
Kerr Matt T and Kerr Ronelle J
Current Estimated Value
Home Financials for this Owner
Home Financials are based on the most recent Mortgage that was taken out on this home.
Original Mortgage
$186,558
Outstanding Balance
$122,070
Interest Rate
5.2%
Mortgage Type
FHA
Estimated Equity
$219,461
Purchase Details
Closed on
Sep 8, 2005
Sold by
Benson Donald L and Benson Nancy J
Bought by
Benson Donald L and Benson Nancy J
Purchase Details
Closed on
Jul 12, 2001
Sold by
Monger Kenneth T and Monger Jeanne
Bought by
Benson Donald L and Benson Nancy J
Purchase Details
Closed on
May 14, 1997
Sold by
Monger Kenneth T and Monger Jeanne
Bought by
Monger Kenneth T and Monger Jeanne
Create a Home Valuation Report for This Property
The Home Valuation Report is an in-depth analysis detailing your home's value as well as a comparison with similar homes in the area
Home Values in the Area
Average Home Value in this Area
Purchase History
| Date | Buyer | Sale Price | Title Company |
|---|---|---|---|
| Kerr Matt T | $190,000 | Placer Title Company | |
| Benson Donald L | -- | -- | |
| Benson Donald L | $22,000 | First American Title Co | |
| Monger Kenneth T | -- | -- |
Source: Public Records
Mortgage History
| Date | Status | Borrower | Loan Amount |
|---|---|---|---|
| Open | Kerr Matt T | $186,558 |
Source: Public Records
Tax History Compared to Growth
Tax History
| Year | Tax Paid | Tax Assessment Tax Assessment Total Assessment is a certain percentage of the fair market value that is determined by local assessors to be the total taxable value of land and additions on the property. | Land | Improvement |
|---|---|---|---|---|
| 2025 | $2,536 | $245,241 | $64,533 | $180,708 |
| 2024 | $2,493 | $240,433 | $63,268 | $177,165 |
| 2023 | $2,493 | $235,720 | $62,028 | $173,692 |
| 2022 | $2,432 | $231,099 | $60,812 | $170,287 |
| 2021 | $2,355 | $226,569 | $59,620 | $166,949 |
| 2020 | $2,395 | $224,247 | $59,009 | $165,238 |
| 2019 | $2,325 | $219,851 | $57,852 | $161,999 |
| 2018 | $2,299 | $215,541 | $56,718 | $158,823 |
| 2017 | $2,287 | $211,315 | $55,606 | $155,709 |
| 2016 | $2,158 | $207,172 | $54,516 | $152,656 |
| 2015 | $2,066 | $204,061 | $53,698 | $150,363 |
| 2014 | $2,040 | $200,065 | $52,647 | $147,418 |
Source: Public Records
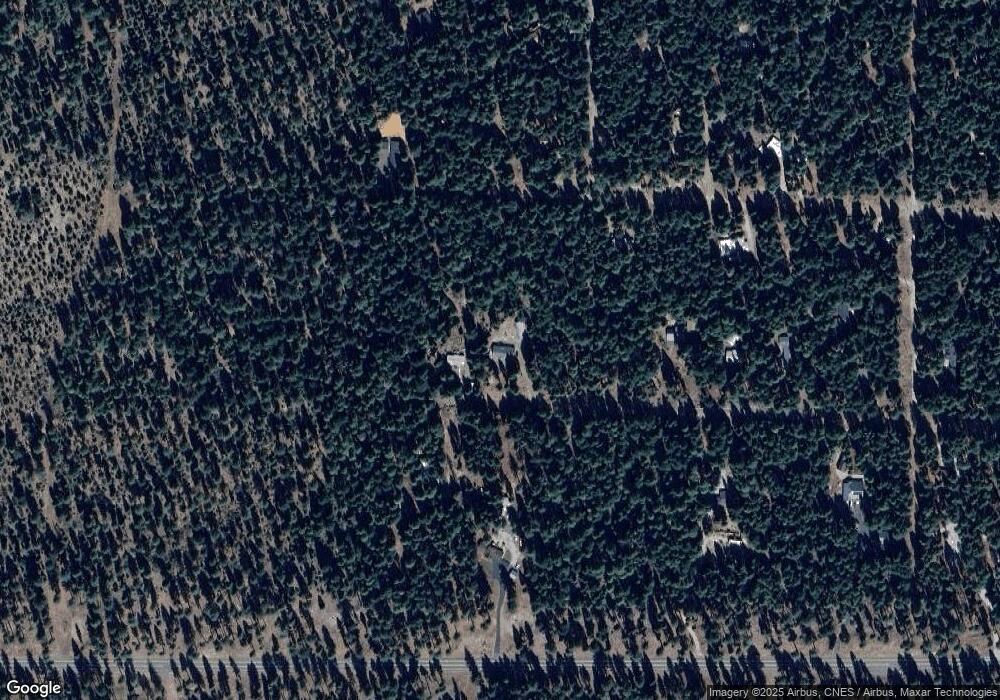
Map
Nearby Homes
- 0 5 19 Ac Side Bottom Rd
- 34739 Timber Ridge Rd
- 34820 Emigrant Trail
- 8379 A and J Ln
- 004 Ritts Mill Rd
- 002 Ritts Mill Rd
- 001 Ritts Mill Rd
- 8238 Starlite Pines Rd
- LOT 28&29 Emerald Way
- 8876 Warner Way
- 0 Savannah Way
- 0 Aurora View Dr
- 8681 Savannah Way
- 8637 Savannah Way
- 0 Oak Ln
- 35486 Wild Turkey Ln
- 0 Manzanita Creek Dr
- 35425 Stonewall Dr
- 7678 Cedar Crest Rd
- 0 Ritts Mill Rd
- 34538 Timber
- 34560 Timber Ridge Rd
- Lot 36 Westward ho Rd
- 34561 Westward ho Rd
- Lot 37 Westward ho Rd
- 111 Westward ho
- 34584 Timber Ridge Rd
- Lot # 10 Wagon Trail
- 34530 State Highway 44
- 34530 California 44
- 34515 Westward ho Rd
- 34596 Timber Ridge Rd
- 8196 Wagon Trail
- 34599 Westward ho Rd
- 34580 Westward ho Rd
- 34604 State Highway 44
- 34604 California 44
- 34612 Timber Ridge Rd
- #70 Hoedown Ln
- 8200 Wagon Trail