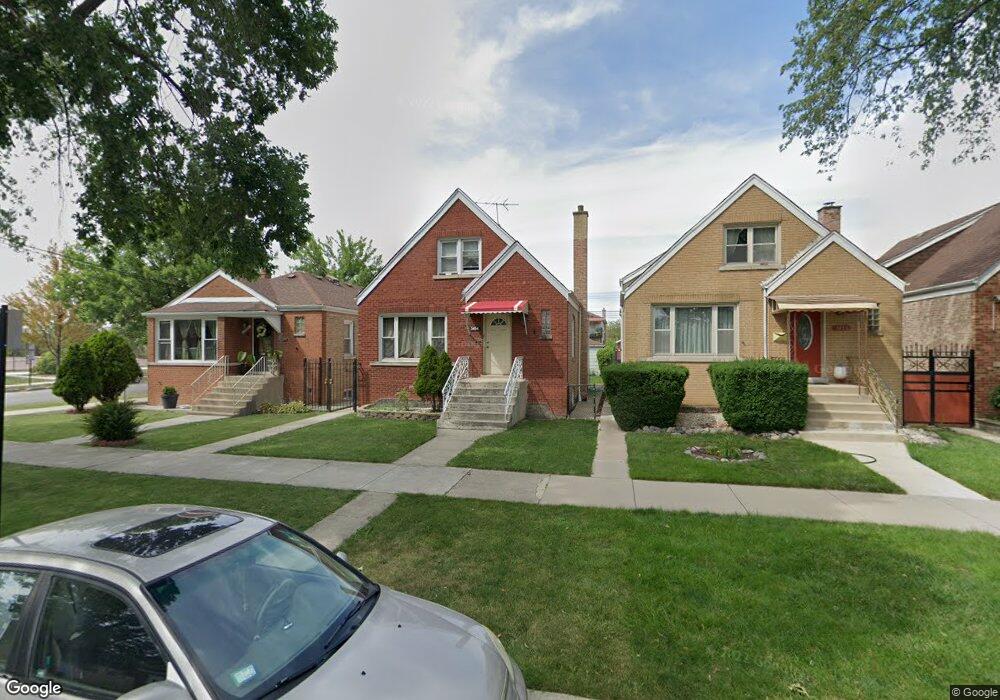
3454 W 53rd Place Chicago, IL 60632
Gage Park NeighborhoodEstimated Value: $251,000 - $328,000
4
Beds
1
Bath
1,339
Sq Ft
$214/Sq Ft
Est. Value
About This Home
This home is located at 3454 W 53rd Place, Chicago, IL 60632 and is currently estimated at $286,070, approximately $213 per square foot. 3454 W 53rd Place is a home located in Cook County with nearby schools including Sawyer Elementary School, Solorio Acad High School, and Acero - Jovita Idar Elementary School.
Ownership History
Date
Name
Owned For
Owner Type
Purchase Details
Closed on
Mar 31, 2010
Sold by
Colin Sergio
Bought by
Colin Abel and Colin Graciela
Current Estimated Value
Purchase Details
Closed on
Oct 6, 2008
Sold by
Hud
Bought by
Colin Sergio
Purchase Details
Closed on
Mar 12, 2007
Sold by
Ramirez Alfonso J
Bought by
Hud
Purchase Details
Closed on
Apr 7, 2004
Sold by
Hernandez Aurelio J and Hernandez Griselda
Bought by
Ramirez Alfonso J
Home Financials for this Owner
Home Financials are based on the most recent Mortgage that was taken out on this home.
Original Mortgage
$200,848
Interest Rate
5.48%
Mortgage Type
FHA
Purchase Details
Closed on
Nov 8, 1996
Sold by
Jaeger George E and Jaeger Shirley A
Bought by
Hernandez Aurelio J and Ferreira Griselda
Home Financials for this Owner
Home Financials are based on the most recent Mortgage that was taken out on this home.
Original Mortgage
$89,877
Interest Rate
8.18%
Mortgage Type
FHA
Create a Home Valuation Report for This Property
The Home Valuation Report is an in-depth analysis detailing your home's value as well as a comparison with similar homes in the area
Home Values in the Area
Average Home Value in this Area
Purchase History
| Date | Buyer | Sale Price | Title Company |
|---|---|---|---|
| Colin Abel | -- | Chicago Title Insurance Co | |
| Colin Sergio | -- | Stewart Title Of Illinois | |
| Hud | -- | None Available | |
| Ramirez Alfonso J | $204,000 | Multiple | |
| Hernandez Aurelio J | $90,000 | Attorneys Natl Title Network |
Source: Public Records
Mortgage History
| Date | Status | Borrower | Loan Amount |
|---|---|---|---|
| Previous Owner | Ramirez Alfonso J | $200,848 | |
| Previous Owner | Hernandez Aurelio J | $89,877 |
Source: Public Records
Tax History Compared to Growth
Tax History
| Year | Tax Paid | Tax Assessment Tax Assessment Total Assessment is a certain percentage of the fair market value that is determined by local assessors to be the total taxable value of land and additions on the property. | Land | Improvement |
|---|---|---|---|---|
| 2024 | $2,903 | $20,000 | $1,890 | $18,110 |
| 2023 | $2,809 | $17,000 | $3,213 | $13,787 |
| 2022 | $2,809 | $17,000 | $3,213 | $13,787 |
| 2021 | $2,749 | $17,000 | $3,213 | $13,787 |
| 2020 | $2,218 | $12,996 | $3,213 | $9,783 |
| 2019 | $2,293 | $14,769 | $3,213 | $11,556 |
| 2018 | $2,253 | $14,769 | $3,213 | $11,556 |
| 2017 | $2,355 | $14,242 | $2,835 | $11,407 |
| 2016 | $2,368 | $14,242 | $2,835 | $11,407 |
| 2015 | $2,629 | $14,242 | $2,835 | $11,407 |
| 2014 | $1,971 | $10,540 | $2,646 | $7,894 |
| 2013 | $1,932 | $10,540 | $2,646 | $7,894 |
Source: Public Records
Map
Nearby Homes
- 3415 W 53rd Place
- 5348 S Christiana Ave
- 3428 W 55th St
- 5234 S Homan Ave
- 3615 W 54th St
- 5146 S Homan Ave
- 5121 S Trumbull Ave
- 5130 S Christiana Ave
- 5359 S Sawyer Ave
- 3642 W 51st St
- 3711 W 56th Place
- 5621 S Sawyer Ave
- 5142 S Hamlin Ave
- 5730 S Trumbull Ave
- 3704 W 57th St
- 3641 W 57th St
- 5044 S Ridgeway Ave
- 5151 S Troy St
- 5145 S Troy St
- 5707 S Spaulding Ave
- 3450 W 53rd Place
- 3458 W 53rd Place
- 3448 W 53rd Place
- 3440 W 53rd Place
- 3455 W 53rd St
- 3453 W 53rd St
- 3459 W 53rd St
- 3449 W 53rd St
- 3438 W 53rd Place
- 3445 W 53rd St
- 3443 W 53rd St
- 3434 W 53rd Place
- 3453 W 53rd Place
- 3457 W 53rd Place
- 3451 W 53rd Place
- 3439 W 53rd St
- 3447 W 53rd Place
- 3432 W 53rd Place
- 3443 W 53rd Place
- 3437 W 53rd St