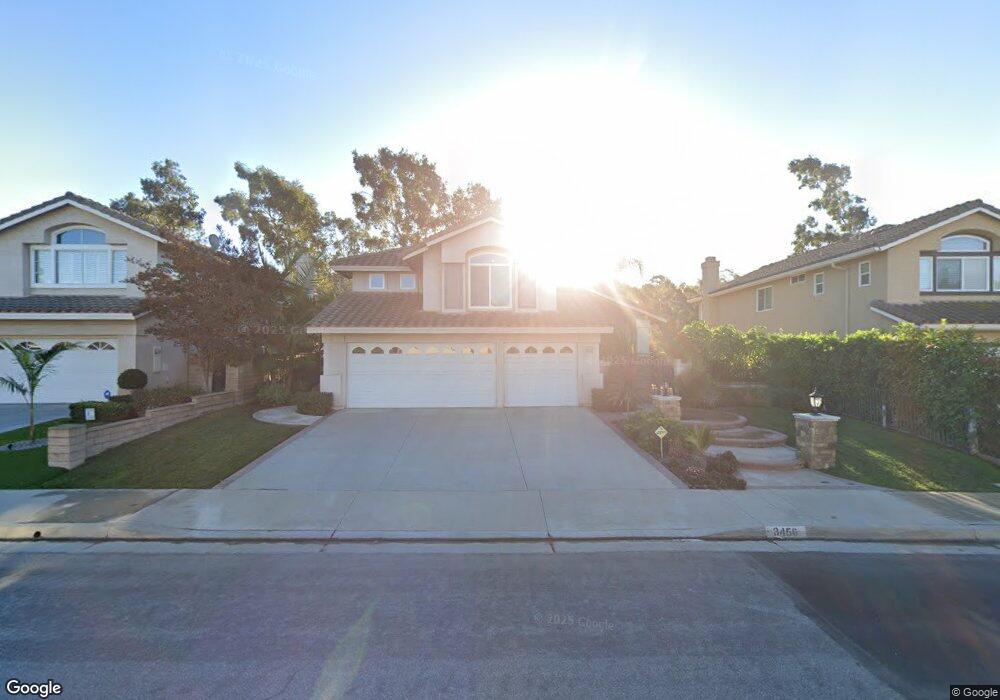
3456 Castleford Place Rowland Heights, CA 91748
Estimated Value: $1,342,596 - $1,424,000
4
Beds
3
Baths
2,668
Sq Ft
$520/Sq Ft
Est. Value
About This Home
This home is located at 3456 Castleford Place, Rowland Heights, CA 91748 and is currently estimated at $1,387,649, approximately $520 per square foot. 3456 Castleford Place is a home located in Los Angeles County with nearby schools including Shelyn Elementary School, Alvarado Intermediate School, and John A. Rowland High School.
Ownership History
Date
Name
Owned For
Owner Type
Purchase Details
Closed on
Feb 4, 2020
Sold by
Qu Shu
Bought by
Qu Shu and Squ 2020 Trust
Current Estimated Value
Purchase Details
Closed on
Apr 19, 2007
Sold by
Pan Qiqun
Bought by
Qu Shu
Purchase Details
Closed on
Dec 30, 1997
Sold by
Chan Tony H
Bought by
Pan Qiqun and Qu Shu
Home Financials for this Owner
Home Financials are based on the most recent Mortgage that was taken out on this home.
Original Mortgage
$170,000
Interest Rate
6.97%
Purchase Details
Closed on
Oct 20, 1993
Sold by
Vantage Point Associates Lp
Bought by
Chan Tony Hon Wah
Home Financials for this Owner
Home Financials are based on the most recent Mortgage that was taken out on this home.
Original Mortgage
$200,000
Interest Rate
6.95%
Create a Home Valuation Report for This Property
The Home Valuation Report is an in-depth analysis detailing your home's value as well as a comparison with similar homes in the area
Home Values in the Area
Average Home Value in this Area
Purchase History
| Date | Buyer | Sale Price | Title Company |
|---|---|---|---|
| Qu Shu | -- | None Available | |
| Qu Shu | -- | None Available | |
| Pan Qiqun | $311,500 | First American Title | |
| Chan Tony Hon Wah | $310,000 | Chicago Title Company |
Source: Public Records
Mortgage History
| Date | Status | Borrower | Loan Amount |
|---|---|---|---|
| Previous Owner | Pan Qiqun | $170,000 | |
| Previous Owner | Chan Tony Hon Wah | $200,000 |
Source: Public Records
Tax History Compared to Growth
Tax History
| Year | Tax Paid | Tax Assessment Tax Assessment Total Assessment is a certain percentage of the fair market value that is determined by local assessors to be the total taxable value of land and additions on the property. | Land | Improvement |
|---|---|---|---|---|
| 2025 | $6,517 | $497,367 | $216,989 | $280,378 |
| 2024 | $6,517 | $487,616 | $212,735 | $274,881 |
| 2023 | $6,256 | $478,056 | $208,564 | $269,492 |
| 2022 | $6,069 | $468,683 | $204,475 | $264,208 |
| 2021 | $5,959 | $459,494 | $200,466 | $259,028 |
| 2019 | $5,780 | $445,867 | $194,521 | $251,346 |
| 2018 | $5,530 | $437,125 | $190,707 | $246,418 |
| 2016 | $8,560 | $420,152 | $183,302 | $236,850 |
| 2015 | $8,457 | $413,842 | $180,549 | $233,293 |
| 2014 | $8,181 | $405,737 | $177,013 | $228,724 |
Source: Public Records
Map
Nearby Homes
- 18109 Graystone Way
- 18489 Stonegate Ln
- 18559 Stonegate Ln
- 2503 Donosa Dr
- 1929 Coban Rd
- 2190 Choral Dr
- 18555 Fieldbrook St
- 2426 Batson Ave
- 2330 Donosa Dr
- 18220 Gallineta St
- 0 Airoso Rd
- 18593 Fieldbrook St
- 2521 Doubletree Ln
- 1006 W Dorothy Dr
- 18239 Villa Clara St
- 17812 Gallineta St
- 17712 Nearbank Dr
- 1318 Alta Mesa Dr
- 1500 Kashlan Rd
- 2634 Blandford Dr
- 3450 Castleford Place
- 3462 Castleford Place
- 3468 Castleford Place
- 3455 Castleford Place
- 3461 Castleford Place
- 3447 Castleford Place
- 3436 Castleford Place
- 3476 Castleford Place
- 3439 Castleford Place
- 3479 Castleford Place
- 3430 Castleford Place
- 3433 Castleford Place
- 3480 Castleford Place
- 3416 Vantage Pointe Dr
- 3422 Vantage Pointe Dr
- 3408 Vantage Pointe Dr
- 3428 Vantage Pointe Dr
- 3438 Vantage Pointe Dr
- 3406 Vantage Pointe Dr
- 3426 Castleford Place