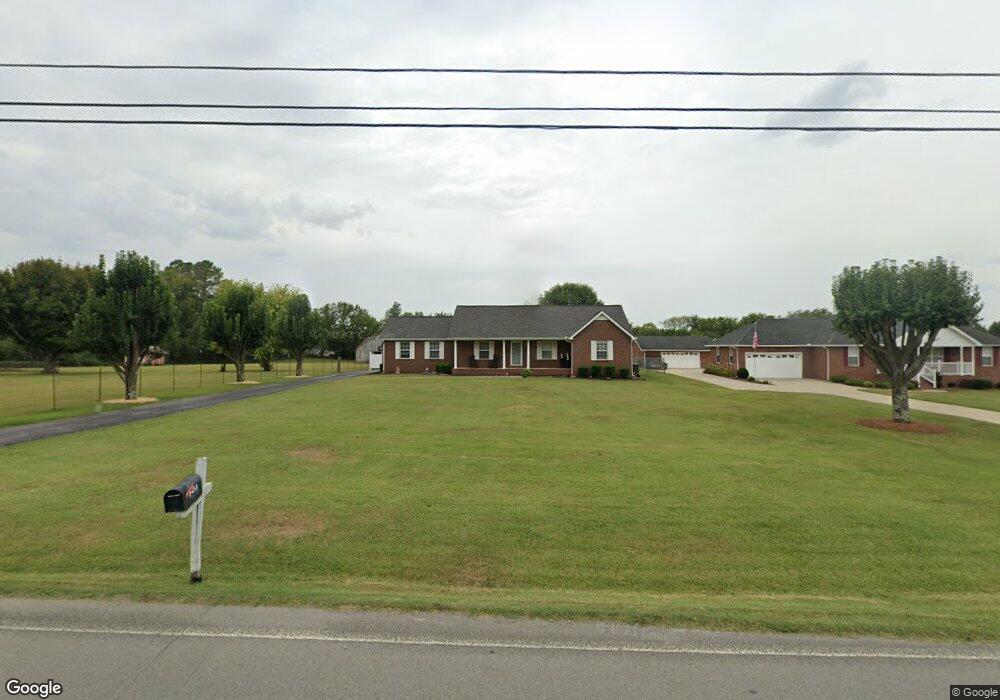
3457 Leanna Rd Murfreesboro, TN 37129
Estimated Value: $424,000 - $484,379
--
Bed
3
Baths
2,010
Sq Ft
$230/Sq Ft
Est. Value
About This Home
This home is located at 3457 Leanna Rd, Murfreesboro, TN 37129 and is currently estimated at $462,095, approximately $229 per square foot. 3457 Leanna Rd is a home located in Rutherford County with nearby schools including Walter Hill Elementary School, Siegel Middle School, and Siegel High School.
Ownership History
Date
Name
Owned For
Owner Type
Purchase Details
Closed on
Oct 13, 2011
Sold by
Bonadona Vincent
Bought by
Carpenter Robert F
Current Estimated Value
Home Financials for this Owner
Home Financials are based on the most recent Mortgage that was taken out on this home.
Original Mortgage
$169,500
Outstanding Balance
$115,940
Interest Rate
4.16%
Mortgage Type
VA
Estimated Equity
$346,155
Purchase Details
Closed on
Mar 13, 2006
Sold by
Nipper Matthew J
Bought by
Bonadona Vincent C and Bonadona Rosera C
Purchase Details
Closed on
Apr 30, 2004
Sold by
Handley and Angelina
Bought by
Nipper Matthw J and Nipper Marissa
Home Financials for this Owner
Home Financials are based on the most recent Mortgage that was taken out on this home.
Original Mortgage
$144,531
Interest Rate
5.36%
Purchase Details
Closed on
Aug 25, 2003
Sold by
Tillery Howard G and Tillery Deborah
Bought by
Handley Angelina R
Purchase Details
Closed on
Jul 11, 1995
Bought by
Tillery Howard G
Create a Home Valuation Report for This Property
The Home Valuation Report is an in-depth analysis detailing your home's value as well as a comparison with similar homes in the area
Home Values in the Area
Average Home Value in this Area
Purchase History
| Date | Buyer | Sale Price | Title Company |
|---|---|---|---|
| Carpenter Robert F | $169,500 | -- | |
| Bonadona Vincent C | $160,000 | -- | |
| Nipper Matthw J | $146,800 | -- | |
| Handley Angelina R | -- | -- | |
| Tillery Howard G | $15,950 | -- |
Source: Public Records
Mortgage History
| Date | Status | Borrower | Loan Amount |
|---|---|---|---|
| Open | Carpenter Robert F | $169,500 | |
| Previous Owner | Tillery Howard G | $144,531 |
Source: Public Records
Tax History Compared to Growth
Tax History
| Year | Tax Paid | Tax Assessment Tax Assessment Total Assessment is a certain percentage of the fair market value that is determined by local assessors to be the total taxable value of land and additions on the property. | Land | Improvement |
|---|---|---|---|---|
| 2025 | $1,707 | $91,000 | $13,750 | $77,250 |
| 2024 | $1,707 | $91,000 | $13,750 | $77,250 |
| 2023 | $1,707 | $91,000 | $13,750 | $77,250 |
| 2022 | $1,472 | $91,088 | $13,750 | $77,338 |
| 2021 | $1,409 | $63,488 | $8,750 | $54,738 |
| 2020 | $1,409 | $63,488 | $8,750 | $54,738 |
| 2019 | $1,409 | $63,488 | $8,750 | $54,738 |
| 2018 | $1,333 | $63,488 | $0 | $0 |
| 2017 | $1,282 | $47,850 | $0 | $0 |
| 2016 | $1,282 | $47,850 | $0 | $0 |
| 2015 | $1,282 | $47,850 | $0 | $0 |
| 2014 | $1,190 | $47,850 | $0 | $0 |
| 2013 | -- | $47,775 | $0 | $0 |
Source: Public Records
Map
Nearby Homes
- 3417 Leanna Rd Unit LT 10A
- 0 Unit RTC3002253
- 3433 Cortona Way
- 3533 John Richards Dr
- 3543 John Richards Dr
- Bancroft Plan at Kings Landing
- Alamont Plan at Kings Landing
- Chelsey Plan at Kings Landing
- 3187 N Thompson Ln
- 3522 Winterfell Dr
- 3432 Winterfell Dr
- 3526 Winterfell Dr
- 3420 Winterfell Dr
- 3534 Winterfell Dr
- 3428 Winterfell Dr
- 3530 Winterfell Dr
- 3424 Winterfell Dr
- 3538 Winterfell Dr
- 1831 Pennington Dr
- 3508 Pershing Dr
- 3461 Leanna Rd
- 3437 Leanna Rd
- 3465 Leanna Rd
- 809 Henry Ln
- 3458 Leanna Rd
- 3448 Leanna Rd
- 815 Henry Ln
- 3440 Leanna Rd
- 3469 Leanna Rd Unit 71
- 3428 Leanna Rd
- 808 Henry Ln
- 3477 Leanna Rd Unit 3479
- 820 Henry Ln
- 3418 Leanna Rd Unit 20
- 814 Henry Ln
- 3432 Meadow Ct
- 3416 Meadow Ct
- 3430 Meadow Ct Unit 3432
- 3468 Leanna Rd
- 3408 Meadow Ct