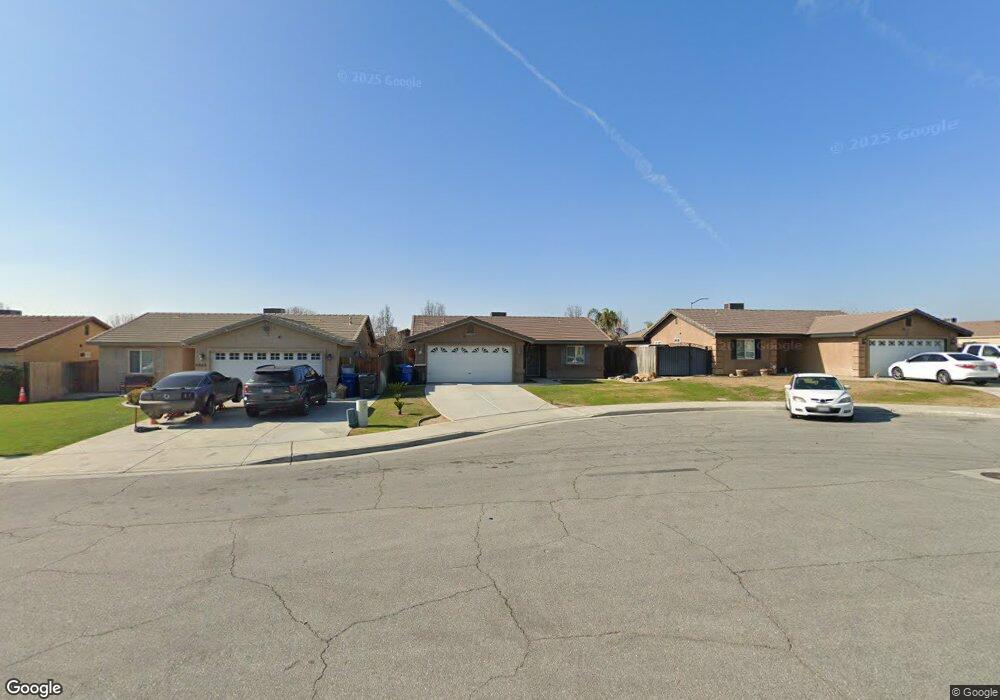
3457 Park Meadows Dr Bakersfield, CA 93308
Meadow View NeighborhoodEstimated Value: $354,914 - $383,000
4
Beds
2
Baths
1,343
Sq Ft
$279/Sq Ft
Est. Value
About This Home
This home is located at 3457 Park Meadows Dr, Bakersfield, CA 93308 and is currently estimated at $374,979, approximately $279 per square foot. 3457 Park Meadows Dr is a home located in Kern County with nearby schools including Highland Elementary School, Standard Middle School, and North High School.
Ownership History
Date
Name
Owned For
Owner Type
Purchase Details
Closed on
Dec 17, 2009
Sold by
A & A Newsom Homes Inc
Bought by
Tavorn Shirley A
Current Estimated Value
Home Financials for this Owner
Home Financials are based on the most recent Mortgage that was taken out on this home.
Original Mortgage
$100,000
Outstanding Balance
$64,485
Interest Rate
4.68%
Mortgage Type
New Conventional
Estimated Equity
$310,494
Purchase Details
Closed on
Sep 14, 2009
Sold by
Newsom Allen L and Allen L Newsom Trust
Bought by
A & A Newsom Homes Inc
Purchase Details
Closed on
Dec 4, 2006
Sold by
Denela Llc
Bought by
10 Plus Homes Inc
Purchase Details
Closed on
Apr 26, 2006
Sold by
10 Plus Homes Inc
Bought by
Newsom Allen L and The Allen L Newsom Trust
Create a Home Valuation Report for This Property
The Home Valuation Report is an in-depth analysis detailing your home's value as well as a comparison with similar homes in the area
Home Values in the Area
Average Home Value in this Area
Purchase History
| Date | Buyer | Sale Price | Title Company |
|---|---|---|---|
| Tavorn Shirley A | $156,000 | Placer Title Company | |
| A & A Newsom Homes Inc | -- | Placer Title Company | |
| 10 Plus Homes Inc | $404,500 | Ticor Title Company Of Ca | |
| Newsom Allen L | $950,000 | Ticor Title Company Of Ca |
Source: Public Records
Mortgage History
| Date | Status | Borrower | Loan Amount |
|---|---|---|---|
| Open | Tavorn Shirley A | $100,000 |
Source: Public Records
Tax History Compared to Growth
Tax History
| Year | Tax Paid | Tax Assessment Tax Assessment Total Assessment is a certain percentage of the fair market value that is determined by local assessors to be the total taxable value of land and additions on the property. | Land | Improvement |
|---|---|---|---|---|
| 2025 | $3,510 | $199,854 | $38,430 | $161,424 |
| 2024 | $3,397 | $195,936 | $37,677 | $158,259 |
| 2023 | $3,397 | $192,095 | $36,939 | $155,156 |
| 2022 | $3,300 | $188,329 | $36,215 | $152,114 |
| 2021 | $3,196 | $184,637 | $35,505 | $149,132 |
| 2020 | $3,089 | $182,744 | $35,141 | $147,603 |
| 2019 | $3,049 | $182,744 | $35,141 | $147,603 |
| 2018 | $2,945 | $175,649 | $33,777 | $141,872 |
| 2017 | $2,929 | $172,206 | $33,115 | $139,091 |
| 2016 | $2,658 | $168,830 | $32,466 | $136,364 |
| 2015 | $2,616 | $166,295 | $31,979 | $134,316 |
| 2014 | $2,560 | $163,038 | $31,353 | $131,685 |
Source: Public Records
Map
Nearby Homes
- 835 Sunset Meadow Ln
- 850 Greenwood Meadow Ln
- 803 Greenwood Meadow Ln
- 650 Sunset Meadow Ln
- 609 Shady Meadow Ct
- 636 W Day Ave
- 624 W Day Ave
- 3252 Floral Meadow Dr
- 3009 Pinecreek Ct
- 3008 Dalea St
- 540 Shady Meadow Ct
- 4109 Highland Hills St
- 4113 Highland Hills St
- 514 Blue Meadow Ct
- 444 Rian Noelle Ct
- 437 Rian Noelle Ct
- 349 Dani Rose Ln
- 2701 Deerbrook St
- 408 Brite Meadow Ct
- 4218 Orrick Ct
- 3449 Park Meadows Dr
- 3461 Park Meadows Dr
- 3445 Park Meadows Dr
- 3437 Park Meadows Dr
- 3464 Rustic Meadow Ct
- 3464 Rustic Meadow Ct Unit ABCD
- 3440 Rustic Meadow Ct
- 3440 Rustic Meadow Ct Unit ABCD
- 3429 Park Meadows Dr
- 3462 Park Meadows Dr
- 3450 Park Meadows Dr
- 3458 Park Meadows Dr
- 3454 Rustic Meadow Ct Unit 4
- 3454 Rustic Meadow Ct
- 3454 Rustic Meadow Ct Unit ABCD
- 3432 Rustic Meadow Ct Unit CD
- 3432 Rustic Meadow Ct
- 3432 Rustic Meadow Ct Unit ABCD
- 3444 Park Meadows Dr
- 3421 Park Meadows Dr