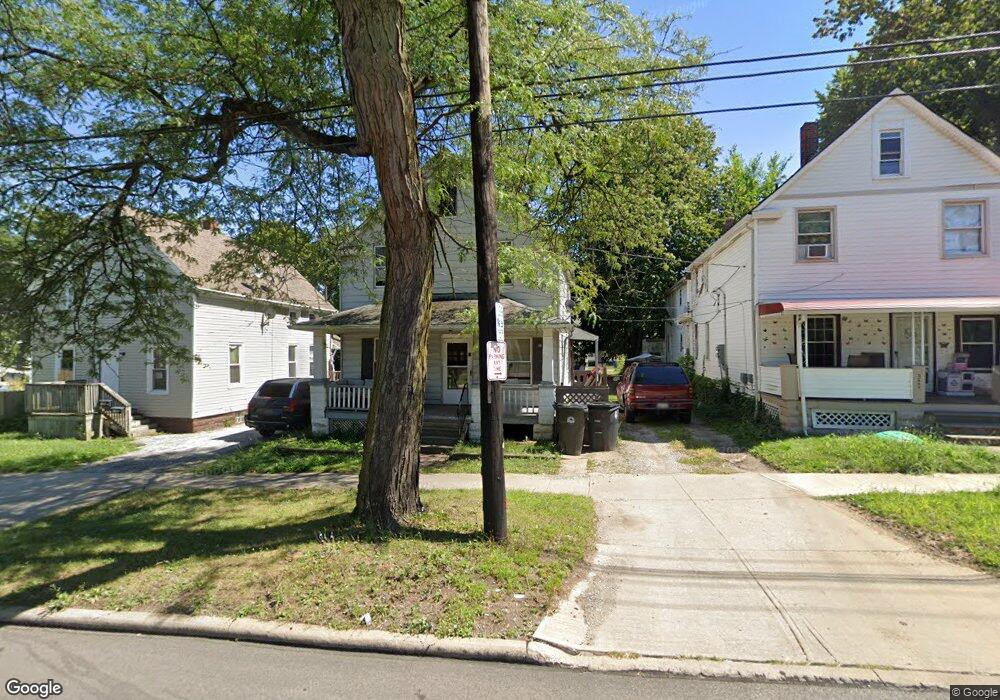
3459 W 65th St Cleveland, OH 44102
Stockyards NeighborhoodEstimated Value: $93,367 - $138,000
3
Beds
2
Baths
1,320
Sq Ft
$82/Sq Ft
Est. Value
About This Home
This home is located at 3459 W 65th St, Cleveland, OH 44102 and is currently estimated at $108,842, approximately $82 per square foot. 3459 W 65th St is a home located in Cuyahoga County with nearby schools including Almira Academy, Benjamin Franklin, and Artemus Ward School.
Ownership History
Date
Name
Owned For
Owner Type
Purchase Details
Closed on
Dec 26, 2021
Sold by
Beulah Mitchell
Bought by
444 Group Llc
Current Estimated Value
Purchase Details
Closed on
Nov 8, 2016
Sold by
Mitchell Crystall L
Bought by
Mitchell Bevlah S
Purchase Details
Closed on
Dec 2, 2010
Sold by
Shinault Darry L
Bought by
Mitchell Crystal
Purchase Details
Closed on
May 4, 2010
Sold by
Mitchell Crystal
Bought by
Shinault Darryl
Purchase Details
Closed on
Feb 16, 2007
Sold by
Mitchell Beulah
Bought by
Mitchell Crystal
Purchase Details
Closed on
Feb 2, 2007
Sold by
Becherucci Norma
Bought by
Mitchell Beulah
Purchase Details
Closed on
Jul 2, 1981
Sold by
Marcum Samuel
Bought by
Becherucci Norma J
Purchase Details
Closed on
Sep 23, 1977
Sold by
Mangol Margaret
Bought by
Marcum Samuel
Purchase Details
Closed on
Jun 28, 1977
Sold by
Papp Francis
Bought by
Mangol Margaret
Purchase Details
Closed on
Jan 1, 1975
Bought by
Papp Francis
Create a Home Valuation Report for This Property
The Home Valuation Report is an in-depth analysis detailing your home's value as well as a comparison with similar homes in the area
Home Values in the Area
Average Home Value in this Area
Purchase History
| Date | Buyer | Sale Price | Title Company |
|---|---|---|---|
| 444 Group Llc | -- | None Listed On Document | |
| Mitchell Bevlah S | $20,874 | None Available | |
| Mitchell Crystal | $36,100 | None Available | |
| Shinault Darryl | $36,100 | Public | |
| Mitchell Crystal | -- | Attorney | |
| Mitchell Beulah | $20,300 | Attorney | |
| Becherucci Norma J | $22,000 | -- | |
| Marcum Samuel | $15,900 | -- | |
| Mangol Margaret | -- | -- | |
| Papp Francis | -- | -- |
Source: Public Records
Tax History Compared to Growth
Tax History
| Year | Tax Paid | Tax Assessment Tax Assessment Total Assessment is a certain percentage of the fair market value that is determined by local assessors to be the total taxable value of land and additions on the property. | Land | Improvement |
|---|---|---|---|---|
| 2024 | $1,168 | $17,465 | $5,635 | $11,830 |
| 2023 | $622 | $8,020 | $3,190 | $4,830 |
| 2022 | $0 | $8,015 | $3,185 | $4,830 |
| 2021 | $0 | $8,020 | $3,190 | $4,830 |
| 2020 | $0 | $6,160 | $2,450 | $3,710 |
| 2019 | $919 | $17,600 | $7,000 | $10,600 |
| 2018 | $312 | $6,160 | $2,450 | $3,710 |
| 2017 | $0 | $7,640 | $1,510 | $6,130 |
| 2016 | $625 | $7,640 | $1,510 | $6,130 |
| 2015 | $1,020 | $7,640 | $1,510 | $6,130 |
| 2014 | $703 | $8,470 | $1,680 | $6,790 |
Source: Public Records
Map
Nearby Homes
- 3477 W 63rd St
- 3500 W 62nd St
- 3426 W 65th St
- 3412 W 63rd St
- 3514 W 58th St
- 3492 W 56th St
- 3297 W 61st St
- 5628 Pacific Ave
- 3250 W 61st St
- 3336 W 54th St
- 3326 W 54th St
- 7104 Dearborn Ave
- 3206 W 71st St
- 7501 Berry Ave
- 3306 W 52nd St
- 3625 W 50th St
- 3482 W 49th St
- 3256 W 54th St
- 7114 Brinsmade Ave
- 7408 Wentworth Ave