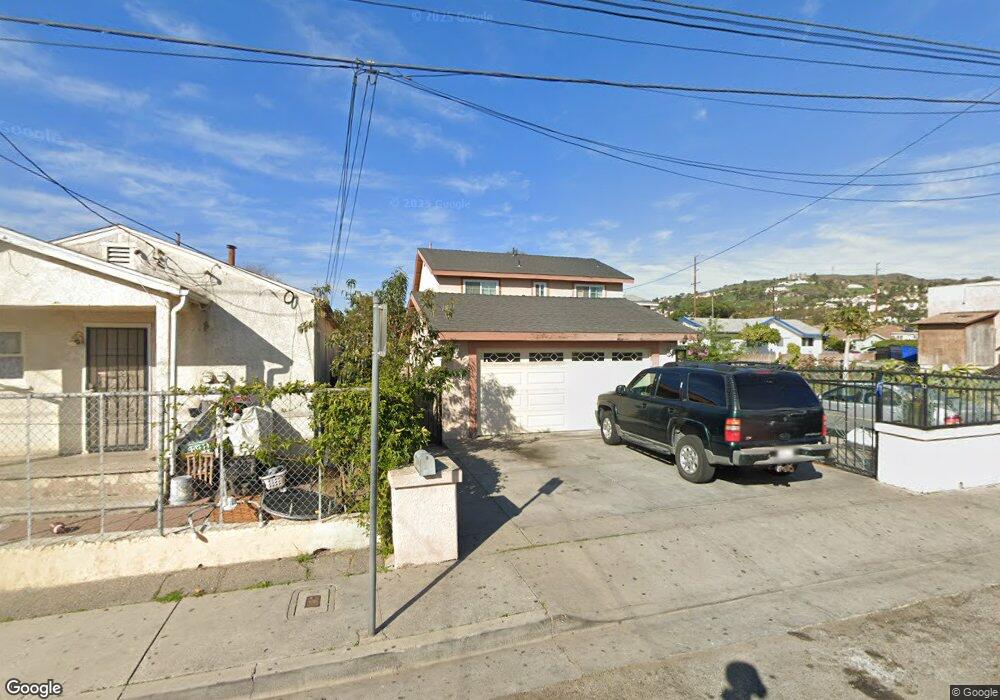
346 Sycamore St Santa Paula, CA 93060
Estimated Value: $606,000 - $714,000
3
Beds
--
Bath
1,196
Sq Ft
$548/Sq Ft
Est. Value
About This Home
This home is located at 346 Sycamore St, Santa Paula, CA 93060 and is currently estimated at $655,881, approximately $548 per square foot. 346 Sycamore St is a home located in Ventura County with nearby schools including Barbara Webster Elementary School, Isbell Middle, and Santa Paula High.
Ownership History
Date
Name
Owned For
Owner Type
Purchase Details
Closed on
Nov 18, 2022
Sold by
Avina Agustin M and Avina Maria M
Bought by
Avina Family 2022 Trust
Current Estimated Value
Purchase Details
Closed on
Oct 29, 2022
Sold by
Zuniga Ernesto and Zuniga Emerita
Bought by
Avina Agustin M and Avina Maria M
Purchase Details
Closed on
Oct 30, 2015
Sold by
Zuniga Ernesto and Zuniga Navarro Emerita
Bought by
Zuniga Ernesto and Zuniga Navarro Emerita
Purchase Details
Closed on
Nov 14, 2003
Sold by
Zuniga Ernesto and Zuniga Emerita
Bought by
Zuniga Ernesto and Zuniga Emerita
Purchase Details
Closed on
Sep 22, 1999
Sold by
Torres Benjamin S and Torres Celina V
Bought by
Zuniga Ernesto and Zuniga Emerita
Home Financials for this Owner
Home Financials are based on the most recent Mortgage that was taken out on this home.
Original Mortgage
$165,393
Interest Rate
7.84%
Mortgage Type
FHA
Create a Home Valuation Report for This Property
The Home Valuation Report is an in-depth analysis detailing your home's value as well as a comparison with similar homes in the area
Home Values in the Area
Average Home Value in this Area
Purchase History
| Date | Buyer | Sale Price | Title Company |
|---|---|---|---|
| Avina Family 2022 Trust | -- | -- | |
| Avina Agustin M | -- | -- | |
| Zuniga Ernesto | -- | First American Title Ins Co | |
| Zuniga Ernesto | -- | -- | |
| Zuniga Ernesto | $166,500 | Lawyers Title Company |
Source: Public Records
Mortgage History
| Date | Status | Borrower | Loan Amount |
|---|---|---|---|
| Previous Owner | Zuniga Ernesto | $165,393 | |
| Closed | Zuniga Ernesto | $8,325 |
Source: Public Records
Tax History Compared to Growth
Tax History
| Year | Tax Paid | Tax Assessment Tax Assessment Total Assessment is a certain percentage of the fair market value that is determined by local assessors to be the total taxable value of land and additions on the property. | Land | Improvement |
|---|---|---|---|---|
| 2025 | $7,337 | $650,250 | $422,403 | $227,847 |
| 2024 | $7,337 | $637,500 | $414,120 | $223,380 |
| 2023 | $7,259 | $625,000 | $406,000 | $219,000 |
| 2022 | $2,818 | $241,117 | $130,334 | $110,783 |
| 2021 | $2,810 | $236,390 | $127,779 | $108,611 |
| 2020 | $2,798 | $233,969 | $126,470 | $107,499 |
| 2019 | $2,646 | $229,383 | $123,991 | $105,392 |
| 2018 | $2,613 | $224,886 | $121,560 | $103,326 |
| 2017 | $2,643 | $220,477 | $119,177 | $101,300 |
| 2016 | $2,485 | $216,155 | $116,841 | $99,314 |
| 2015 | $2,378 | $212,910 | $115,087 | $97,823 |
| 2014 | $2,415 | $208,741 | $112,834 | $95,907 |
Source: Public Records
Map
Nearby Homes
- 1214 Saticoy St
- 308 Citrus St
- 317 N Ojai St #Abcde
- 542 N 13th St
- 1500 Richmond Rd Unit 10
- 1500 Richmond Rd Unit 1
- 1500 Richmond Rd Unit 3
- 919 E Virginia Terrace
- 120 S Ojai St
- 963 La Vuelta Place
- 738 E Santa Paula St
- 864 Montclair Dr
- 1234 Woodland Dr
- 344 Campbell Ct
- Lenora Plan at Harvest at Limoneira - Autumnwood
- Leigh Plan at Harvest at Limoneira - Autumnwood
- Lena Plan at Harvest at Limoneira - Autumnwood
- Lennox Plan at Harvest at Limoneira - Autumnwood
- 1009 Laurel Rd
- 439 Snowdrop Ln
- 330 Sycamore St
- 328 Sycamore St
- 1210 Saticoy St
- 326 Sycamore St
- 335 N 12th St
- 333 N 12th St
- 1206 Saticoy St
- 329 N 12th St
- 335 Sycamore St
- 324 Sycamore St
- 343 Sycamore St
- 331 Sycamore St
- 325 N 12th St
- 347 Sycamore St
- 1204 Saticoy St
- 327 Sycamore St
- 351 Sycamore St
- 321 N 12th St
- 322 Sycamore St
- 322 Sycamore St Unit 5