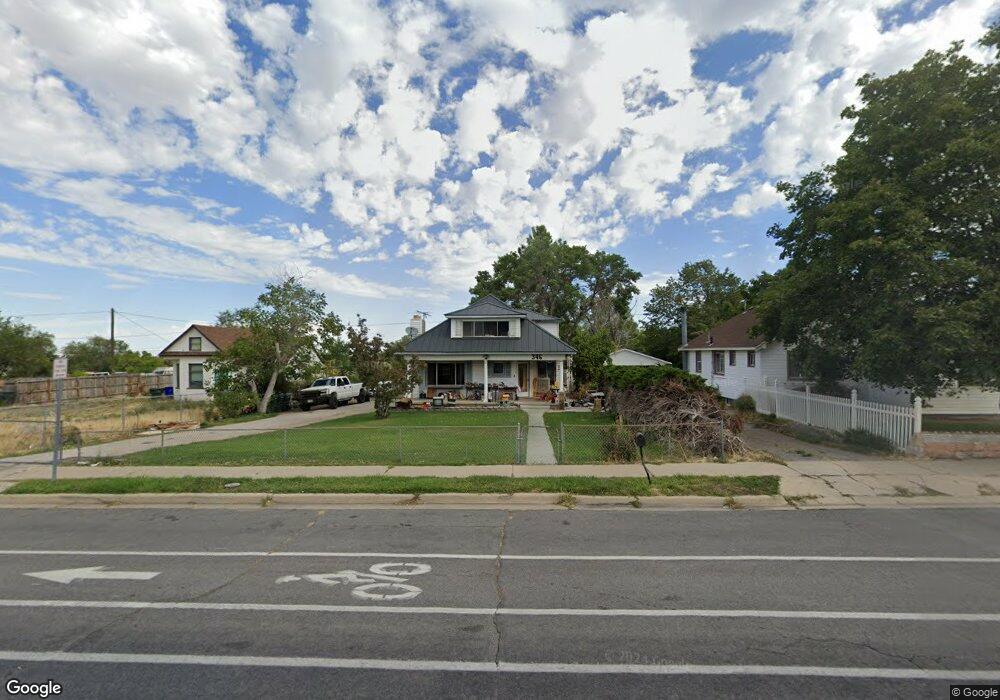
346 W Vine St Tooele, UT 84074
Estimated Value: $379,000 - $454,000
--
Bed
--
Bath
3,319
Sq Ft
$125/Sq Ft
Est. Value
About This Home
This home is located at 346 W Vine St, Tooele, UT 84074 and is currently estimated at $414,212, approximately $124 per square foot. 346 W Vine St is a home located in Tooele County with nearby schools including Northlake Elementary School, Tooele Junior High School, and Tooele High School.
Ownership History
Date
Name
Owned For
Owner Type
Purchase Details
Closed on
Jan 4, 2024
Sold by
Williams Logan Charles
Bought by
Williams Logan Charles and Williams Lutricia D
Current Estimated Value
Home Financials for this Owner
Home Financials are based on the most recent Mortgage that was taken out on this home.
Original Mortgage
$263,145
Outstanding Balance
$258,777
Interest Rate
7.5%
Mortgage Type
FHA
Estimated Equity
$155,435
Purchase Details
Closed on
Dec 20, 2023
Sold by
Donald G And Ruth S Smith Family Trust
Bought by
Williams Logan Charles
Home Financials for this Owner
Home Financials are based on the most recent Mortgage that was taken out on this home.
Original Mortgage
$263,145
Outstanding Balance
$258,777
Interest Rate
7.5%
Mortgage Type
FHA
Estimated Equity
$155,435
Create a Home Valuation Report for This Property
The Home Valuation Report is an in-depth analysis detailing your home's value as well as a comparison with similar homes in the area
Home Values in the Area
Average Home Value in this Area
Purchase History
| Date | Buyer | Sale Price | Title Company |
|---|---|---|---|
| Williams Logan Charles | -- | Inwest Title | |
| Williams Logan Charles | -- | Inwest Title |
Source: Public Records
Mortgage History
| Date | Status | Borrower | Loan Amount |
|---|---|---|---|
| Open | Williams Logan Charles | $263,145 |
Source: Public Records
Tax History Compared to Growth
Tax History
| Year | Tax Paid | Tax Assessment Tax Assessment Total Assessment is a certain percentage of the fair market value that is determined by local assessors to be the total taxable value of land and additions on the property. | Land | Improvement |
|---|---|---|---|---|
| 2025 | $2,699 | $225,162 | $62,700 | $162,462 |
| 2024 | $2,386 | $226,644 | $62,700 | $163,944 |
| 2023 | $2,386 | $188,870 | $59,673 | $129,197 |
| 2022 | $2,889 | $248,590 | $67,100 | $181,490 |
| 2021 | $2,079 | $149,591 | $25,025 | $124,566 |
| 2020 | $1,970 | $245,927 | $45,500 | $200,427 |
| 2019 | $1,790 | $219,784 | $45,500 | $174,284 |
| 2018 | $1,731 | $201,551 | $50,000 | $151,551 |
| 2017 | $1,224 | $169,093 | $36,875 | $132,218 |
| 2016 | $1,025 | $83,516 | $20,281 | $63,235 |
| 2015 | $1,025 | $74,523 | $0 | $0 |
| 2014 | -- | $74,523 | $0 | $0 |
Source: Public Records
Map
Nearby Homes