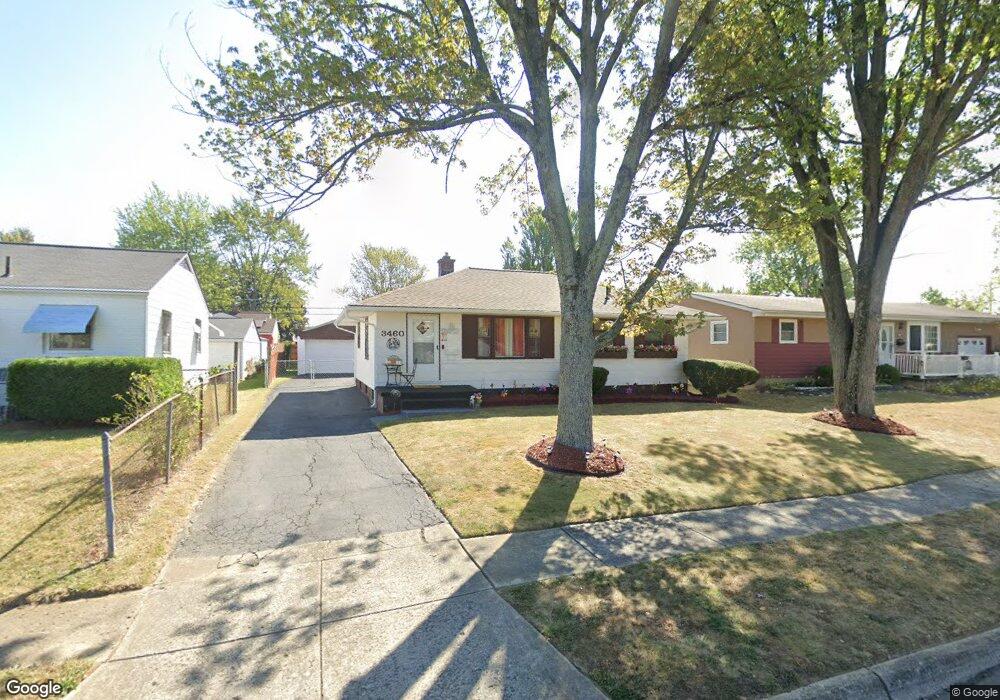
3460 Oaklawn St Columbus, OH 43224
North Linden NeighborhoodEstimated Value: $163,000 - $237,000
2
Beds
1
Bath
988
Sq Ft
$192/Sq Ft
Est. Value
About This Home
This home is located at 3460 Oaklawn St, Columbus, OH 43224 and is currently estimated at $190,157, approximately $192 per square foot. 3460 Oaklawn St is a home located in Franklin County with nearby schools including Huy Elementary School, Medina Middle School, and Mifflin High School.
Ownership History
Date
Name
Owned For
Owner Type
Purchase Details
Closed on
Apr 26, 2002
Sold by
Hud
Bought by
Hope Samantha Y
Current Estimated Value
Home Financials for this Owner
Home Financials are based on the most recent Mortgage that was taken out on this home.
Original Mortgage
$65,013
Outstanding Balance
$27,896
Interest Rate
7.16%
Mortgage Type
Purchase Money Mortgage
Estimated Equity
$162,261
Purchase Details
Closed on
Nov 29, 2001
Sold by
Taylor Kevin G and Mortgage Electronic Registrati
Bought by
Hud
Purchase Details
Closed on
Aug 29, 1995
Sold by
Ressler John D
Bought by
Taylor Kevin G and Taylor Shira M
Home Financials for this Owner
Home Financials are based on the most recent Mortgage that was taken out on this home.
Original Mortgage
$73,750
Interest Rate
7.43%
Mortgage Type
New Conventional
Purchase Details
Closed on
Apr 1, 1986
Purchase Details
Closed on
Nov 1, 1980
Create a Home Valuation Report for This Property
The Home Valuation Report is an in-depth analysis detailing your home's value as well as a comparison with similar homes in the area
Home Values in the Area
Average Home Value in this Area
Purchase History
| Date | Buyer | Sale Price | Title Company |
|---|---|---|---|
| Hope Samantha Y | $65,013 | Contract Processing & Title | |
| Hud | $65,000 | Independent Title | |
| Taylor Kevin G | $73,900 | -- | |
| -- | $57,000 | -- | |
| -- | $45,800 | -- |
Source: Public Records
Mortgage History
| Date | Status | Borrower | Loan Amount |
|---|---|---|---|
| Open | Hope Samantha Y | $65,013 | |
| Previous Owner | Taylor Kevin G | $73,750 |
Source: Public Records
Tax History Compared to Growth
Tax History
| Year | Tax Paid | Tax Assessment Tax Assessment Total Assessment is a certain percentage of the fair market value that is determined by local assessors to be the total taxable value of land and additions on the property. | Land | Improvement |
|---|---|---|---|---|
| 2024 | $2,124 | $57,130 | $12,570 | $44,560 |
| 2023 | $2,125 | $57,120 | $12,565 | $44,555 |
| 2022 | $1,560 | $30,070 | $6,930 | $23,140 |
| 2021 | $1,681 | $30,070 | $6,930 | $23,140 |
| 2020 | $1,564 | $30,070 | $6,930 | $23,140 |
| 2019 | $1,404 | $23,140 | $5,530 | $17,610 |
| 2018 | $1,486 | $23,140 | $5,530 | $17,610 |
| 2017 | $1,403 | $23,140 | $5,530 | $17,610 |
| 2016 | $1,730 | $26,120 | $5,570 | $20,550 |
| 2015 | $1,571 | $26,120 | $5,570 | $20,550 |
| 2014 | $1,575 | $26,120 | $5,570 | $20,550 |
| 2013 | $817 | $27,475 | $5,845 | $21,630 |
Source: Public Records
Map
Nearby Homes
- 3493 Bremen St
- 3462 Dresden St
- 3469 Dresden St
- 3434 Norwood St
- 3591 Bremen St
- 3583 Dresden St
- 1729 Huy Rd
- 1794 Audrey Rd
- 1812 Audrey Rd
- 3491 Ontario St
- 3471 Ontario St
- 1711 Piedmont Rd
- 1905 Elmore Ave
- 3519 Gerbert Rd
- 3585 Gerbert Rd
- 1507 Elmore Ave
- 3750 Dresden St
- 3401 Walmar Dr
- 3749 Ganson Dr
- 3131 Dresden St
- 3468 Oaklawn St
- 3454 Oaklawn St
- 3455 Kenlawn St
- 3449 Kenlawn St
- 3463 Kenlawn St
- 3440 Oaklawn St
- 3441 Kenlawn St
- 3461 Oaklawn St
- 3469 Oaklawn St
- 3453 Oaklawn St
- 3435 Kenlawn St
- 3481 Kenlawn St
- 3432 Oaklawn St
- 3439 Oaklawn St
- 1681 Pauline Ave
- 3485 Oaklawn St
- 3492 Oaklawn St
- 3427 Kenlawn St
- 3487 Kenlawn St
- 3454 Kenlawn St