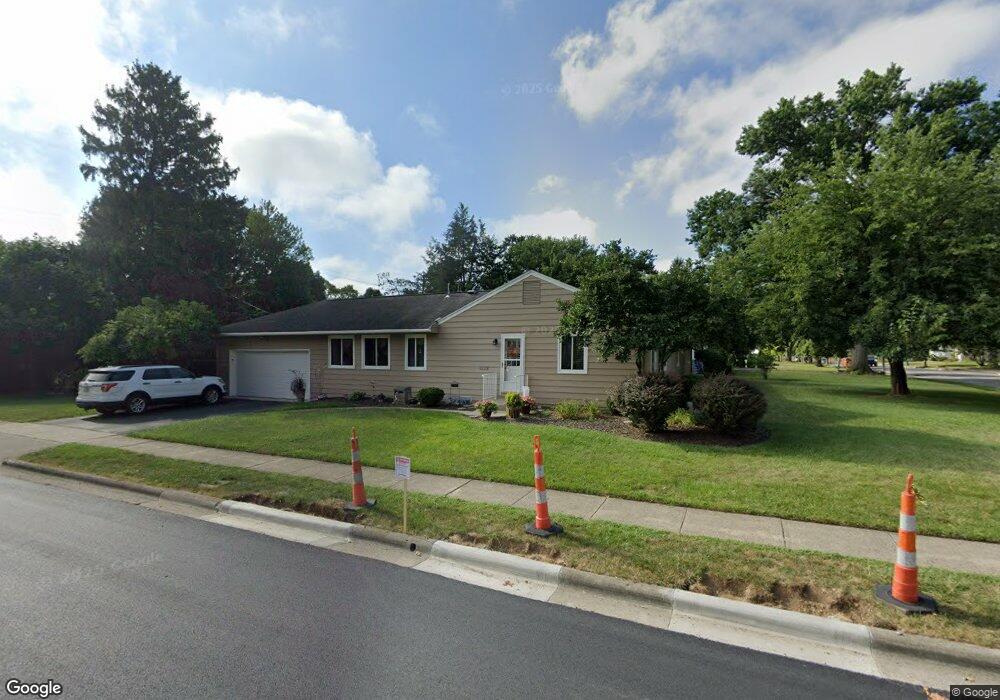
3460 Redding Rd Columbus, OH 43221
Estimated Value: $549,877 - $600,000
3
Beds
4
Baths
1,876
Sq Ft
$307/Sq Ft
Est. Value
About This Home
This home is located at 3460 Redding Rd, Columbus, OH 43221 and is currently estimated at $575,219, approximately $306 per square foot. 3460 Redding Rd is a home located in Franklin County with nearby schools including Windermere Elementary School, Hastings Middle School, and Upper Arlington High School.
Ownership History
Date
Name
Owned For
Owner Type
Purchase Details
Closed on
Sep 8, 2006
Sold by
Nolan Mary H
Bought by
Louys Kurt A and Louys Tara D
Current Estimated Value
Home Financials for this Owner
Home Financials are based on the most recent Mortgage that was taken out on this home.
Original Mortgage
$189,600
Outstanding Balance
$110,997
Interest Rate
6.59%
Mortgage Type
Purchase Money Mortgage
Estimated Equity
$464,222
Purchase Details
Closed on
Dec 11, 2000
Sold by
Nolan Mary H
Bought by
Nolan Mary H and Nolan Vincent J
Purchase Details
Closed on
Nov 10, 2000
Sold by
Nolan Vincent J and Nolan Mary H
Bought by
Nolan Mary H
Purchase Details
Closed on
Jul 25, 1966
Bought by
Nolan Vincent J and Nolan Mary H
Create a Home Valuation Report for This Property
The Home Valuation Report is an in-depth analysis detailing your home's value as well as a comparison with similar homes in the area
Home Values in the Area
Average Home Value in this Area
Purchase History
| Date | Buyer | Sale Price | Title Company |
|---|---|---|---|
| Louys Kurt A | $237,000 | Chicago Tit | |
| Nolan Mary H | -- | -- | |
| Nolan Mary H | -- | -- | |
| Nolan Vincent J | -- | -- |
Source: Public Records
Mortgage History
| Date | Status | Borrower | Loan Amount |
|---|---|---|---|
| Open | Louys Kurt A | $189,600 |
Source: Public Records
Tax History
| Year | Tax Paid | Tax Assessment Tax Assessment Total Assessment is a certain percentage of the fair market value that is determined by local assessors to be the total taxable value of land and additions on the property. | Land | Improvement |
|---|---|---|---|---|
| 2025 | $8,263 | $139,450 | $34,900 | $104,550 |
| 2024 | $8,263 | $139,450 | $34,900 | $104,550 |
| 2023 | $7,973 | $139,440 | $34,895 | $104,545 |
| 2022 | $8,083 | $115,680 | $29,930 | $85,750 |
| 2021 | $7,517 | $115,680 | $29,930 | $85,750 |
| 2020 | $7,092 | $115,680 | $29,930 | $85,750 |
| 2019 | $6,260 | $90,270 | $29,930 | $60,340 |
| 2018 | $5,501 | $90,270 | $29,930 | $60,340 |
| 2017 | $5,497 | $90,270 | $29,930 | $60,340 |
| 2016 | $4,782 | $72,320 | $18,310 | $54,010 |
| 2015 | $4,778 | $72,320 | $18,310 | $54,010 |
| 2014 | $4,783 | $72,320 | $18,310 | $54,010 |
| 2013 | $2,284 | $65,730 | $16,625 | $49,105 |
Source: Public Records
Map
Nearby Homes
- 2257 Swansea Rd
- 3701 Reed Rd
- 1842 Ridgecliff Rd
- 3194 Mountview Rd
- 3175 Tremont Rd Unit 313
- 1744 Ridgecliff Rd Unit 12
- 3106 Somerford Rd
- 2227 Zollinger Rd
- 1872 Kentwell Rd Unit 1872
- 2026 Jervis Rd
- 2413 Edgevale Rd
- 3134 Asbury Dr
- 2480 Shrewsbury Rd
- 2458 Edgevale Rd
- 3900 Hillview Dr
- 2979 Avalon Rd
- 1530 Pemberton Dr
- 3163 S Dorchester Rd
- 2666 Woodstock Rd
- 2200 Nayland Rd
- 3476 Redding Rd
- 3446 Redding Rd
- 2025 Riverhill Rd
- 3441 Sciotangy Dr
- 3488 Redding Rd
- 3467 Sciotangy Dr
- 3440 Redding Rd
- 3435 Sciotangy Dr
- 3459 Redding Rd
- 3477 Sciotangy Dr
- 2075 Riverhill Rd
- 2080 Riverhill Rd
- 3421 Sciotangy Dr
- 3500 Redding Rd
- 3487 Sciotangy Dr
- 3493 Redding Rd
- 3424 Redding Rd
- 3501 Redding Rd
- 3413 Sciotangy Dr
Your Personal Tour Guide
Ask me questions while you tour the home.