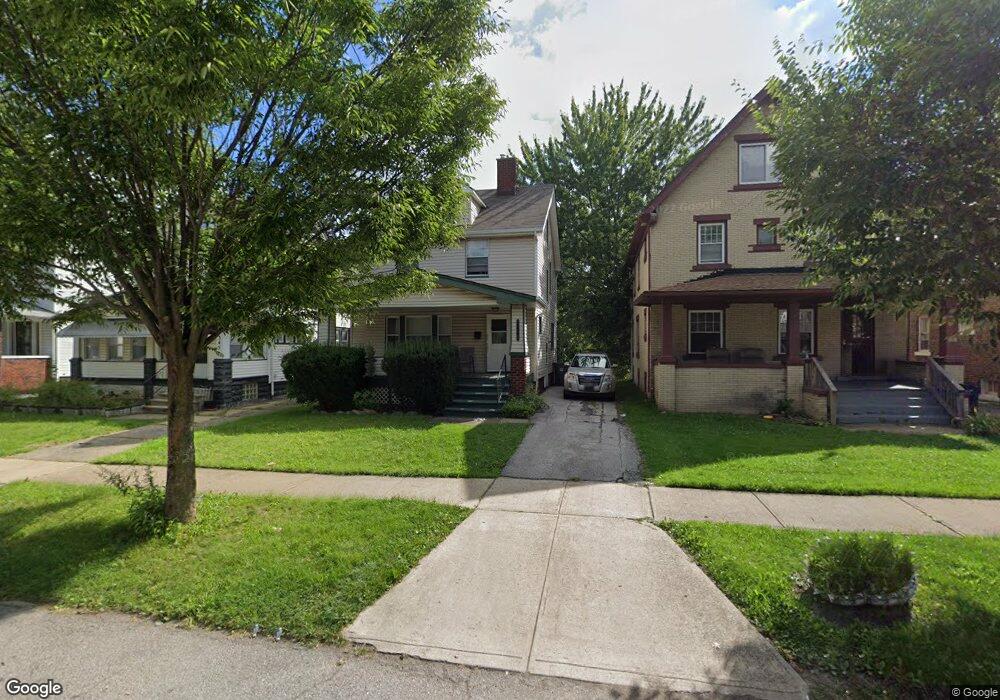
3461 E 110th St Cleveland, OH 44104
Union-Miles Park NeighborhoodEstimated Value: $77,214 - $130,000
3
Beds
1
Bath
1,232
Sq Ft
$78/Sq Ft
Est. Value
About This Home
This home is located at 3461 E 110th St, Cleveland, OH 44104 and is currently estimated at $95,804, approximately $77 per square foot. 3461 E 110th St is a home located in Cuyahoga County with nearby schools including Andrew J. Rickoff School, Anton Grdina School, and Bolton.
Ownership History
Date
Name
Owned For
Owner Type
Purchase Details
Closed on
Jul 25, 2001
Sold by
Cresthaven Development Inc
Bought by
Arrington Tracey N
Current Estimated Value
Home Financials for this Owner
Home Financials are based on the most recent Mortgage that was taken out on this home.
Original Mortgage
$83,023
Outstanding Balance
$32,409
Interest Rate
7.16%
Estimated Equity
$63,395
Purchase Details
Closed on
May 7, 2001
Sold by
Estate Of Essie Lane
Bought by
Lane Royce Henry and Lane Royce N
Purchase Details
Closed on
Apr 30, 2001
Sold by
Lane Alvin P
Bought by
Cresthaven Development Inc
Purchase Details
Closed on
Apr 19, 2001
Sold by
Estate Of Martin N Lane
Bought by
Lane Alvin and Mcdonald Sally
Purchase Details
Closed on
Apr 10, 2001
Sold by
Smith Royce
Bought by
Lane Alvin and Lane Alvin P
Purchase Details
Closed on
Mar 24, 2001
Sold by
Mcdonald Sally
Bought by
Lane Alvin and Lane Alvin P
Purchase Details
Closed on
May 24, 1982
Sold by
Lane Royce N and Lane Essie
Bought by
Lane Essie
Purchase Details
Closed on
Jan 1, 1975
Bought by
Lane Royce N and Lane Essie
Create a Home Valuation Report for This Property
The Home Valuation Report is an in-depth analysis detailing your home's value as well as a comparison with similar homes in the area
Home Values in the Area
Average Home Value in this Area
Purchase History
| Date | Buyer | Sale Price | Title Company |
|---|---|---|---|
| Arrington Tracey N | $95,900 | Choice Title Agency Inc | |
| Lane Royce Henry | -- | -- | |
| Cresthaven Development Inc | -- | -- | |
| Lane Alvin | -- | -- | |
| Lane Alvin | -- | -- | |
| Lane Alvin | -- | -- | |
| Lane Essie | -- | -- | |
| Lane Royce N | -- | -- |
Source: Public Records
Mortgage History
| Date | Status | Borrower | Loan Amount |
|---|---|---|---|
| Open | Arrington Tracey N | $83,023 | |
| Closed | Arrington Tracey N | $9,500 |
Source: Public Records
Tax History Compared to Growth
Tax History
| Year | Tax Paid | Tax Assessment Tax Assessment Total Assessment is a certain percentage of the fair market value that is determined by local assessors to be the total taxable value of land and additions on the property. | Land | Improvement |
|---|---|---|---|---|
| 2024 | $1,482 | $22,610 | $3,430 | $19,180 |
| 2023 | $1,073 | $14,150 | $2,280 | $11,870 |
| 2022 | $1,067 | $14,140 | $2,280 | $11,870 |
| 2021 | $1,056 | $14,140 | $2,280 | $11,870 |
| 2020 | $1,052 | $12,180 | $1,960 | $10,220 |
| 2019 | $973 | $34,800 | $5,600 | $29,200 |
| 2018 | $850 | $12,180 | $1,960 | $10,220 |
| 2017 | $736 | $8,930 | $1,750 | $7,180 |
| 2016 | $731 | $8,930 | $1,750 | $7,180 |
| 2015 | $863 | $8,930 | $1,750 | $7,180 |
| 2014 | $863 | $10,510 | $2,070 | $8,440 |
Source: Public Records
Map
Nearby Homes
- 3445 Martin Luther King jr Dr
- 3409 E 110th St
- 3410 E 110th St
- 3406 E 110th St
- 3535 E 108th St
- 3389 Martin Luther King jr Dr
- 3566 E 108th St
- 3561 E 106th St
- 3415 E 114th St
- 3559 E 105th St
- 3452 E 104th St
- 3361 E 113th St
- 3568 E 114th St
- 3575 E 105th St
- 3546 E 104th St
- 10920 Kinsman Rd
- 3470 E 103rd St
- 3545 E 116th St
- 10201 Gibson Ave
- 3451 E 117th St
- 3457 E 110th St
- 3463 E 110th St
- 3467 E 110th St
- 3453 E 110th St
- 3447 E 110th St
- 3443 E 110th St
- 3468 Martin Luther King jr Dr
- 3460 Martin Luther King jr Dr
- 3470 Martin Luther King jr Dr
- 3450 Martin Luther King jr Dr
- 3439 E 110th St
- 3460 E 110th St
- 3458 E 110th St
- 3464 E 110th St
- 3468 E 110th St
- 3448 Martin Luther King jr Dr
- 3437 E 110th St
- 3450 E 110th St
- 3470 E 110th St
- 3444 Martin Luther King jr Dr