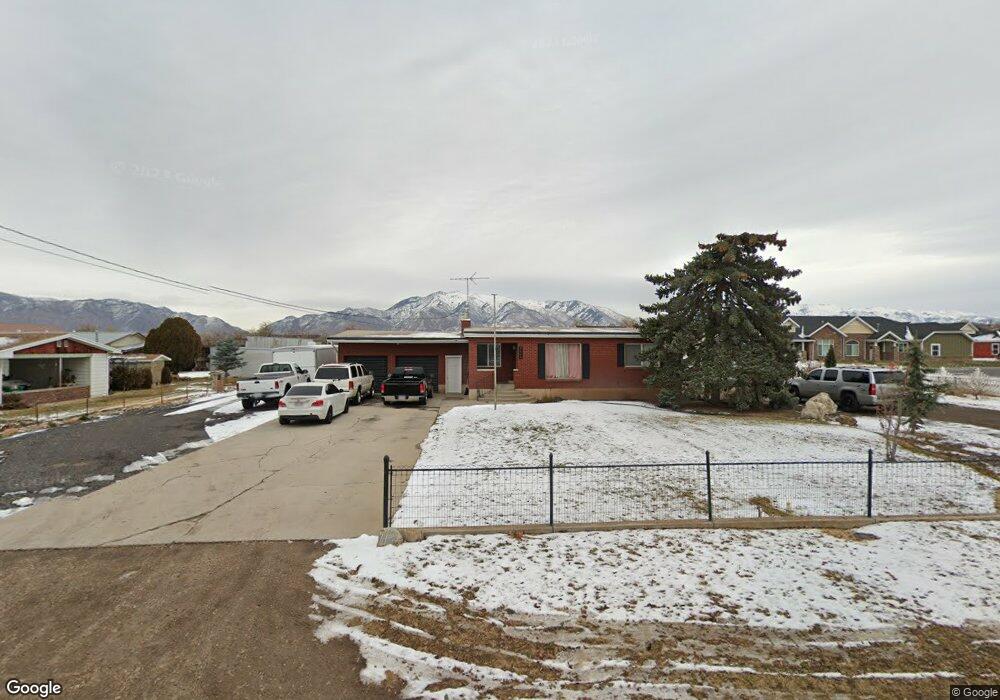
3462 S 2700 W West Haven, UT 84401
Estimated Value: $539,000 - $603,000
3
Beds
2
Baths
1,462
Sq Ft
$389/Sq Ft
Est. Value
About This Home
This home is located at 3462 S 2700 W, West Haven, UT 84401 and is currently estimated at $569,165, approximately $389 per square foot. 3462 S 2700 W is a home located in Weber County with nearby schools including Kanesville Elementary School, Rocky Mountain Junior High School, and Fremont High School.
Ownership History
Date
Name
Owned For
Owner Type
Purchase Details
Closed on
Dec 21, 2020
Sold by
Rackham Ryan S and Rackham Jenny W
Bought by
Rackham Ryan S and Fmt Jenny
Current Estimated Value
Purchase Details
Closed on
Apr 20, 2017
Sold by
Leff Brandon
Bought by
Rackham Ryan S and Rackham Jenna W
Home Financials for this Owner
Home Financials are based on the most recent Mortgage that was taken out on this home.
Original Mortgage
$233,600
Outstanding Balance
$194,390
Interest Rate
4.21%
Mortgage Type
New Conventional
Estimated Equity
$374,775
Purchase Details
Closed on
Apr 14, 2017
Sold by
Rackham Ryan and Rackham Jenny
Bought by
Rackham Ryan S and Rackham Jenny W
Home Financials for this Owner
Home Financials are based on the most recent Mortgage that was taken out on this home.
Original Mortgage
$233,600
Outstanding Balance
$194,390
Interest Rate
4.21%
Mortgage Type
New Conventional
Estimated Equity
$374,775
Purchase Details
Closed on
Mar 29, 2011
Sold by
Whitaker Violet and Whitaker Violet F
Bought by
Whitaker Violet F and The Violet F Whitaker Trust
Create a Home Valuation Report for This Property
The Home Valuation Report is an in-depth analysis detailing your home's value as well as a comparison with similar homes in the area
Home Values in the Area
Average Home Value in this Area
Purchase History
| Date | Buyer | Sale Price | Title Company |
|---|---|---|---|
| Rackham Ryan S | -- | None Available | |
| Rackham Ryan S | -- | Hickman Land Title Co | |
| Rackham Ryan S | -- | Us Title Insurance Agency | |
| Whitaker Violet F | -- | None Available |
Source: Public Records
Mortgage History
| Date | Status | Borrower | Loan Amount |
|---|---|---|---|
| Open | Rackham Ryan S | $233,600 |
Source: Public Records
Tax History Compared to Growth
Tax History
| Year | Tax Paid | Tax Assessment Tax Assessment Total Assessment is a certain percentage of the fair market value that is determined by local assessors to be the total taxable value of land and additions on the property. | Land | Improvement |
|---|---|---|---|---|
| 2025 | $2,930 | $507,134 | $214,653 | $292,481 |
| 2024 | $2,836 | $290,591 | $133,651 | $156,940 |
| 2023 | $2,443 | $248,160 | $113,302 | $134,858 |
| 2022 | $2,525 | $253,550 | $104,392 | $149,158 |
| 2021 | $2,136 | $361,000 | $94,800 | $266,200 |
| 2020 | $2,086 | $322,000 | $89,800 | $232,200 |
| 2019 | $1,997 | $290,000 | $89,800 | $200,200 |
| 2018 | $1,847 | $255,000 | $74,837 | $180,163 |
| 2017 | $1,513 | $204,000 | $69,850 | $134,150 |
| 2016 | $1,348 | $104,324 | $45,100 | $59,224 |
| 2015 | $1,365 | $104,323 | $45,100 | $59,223 |
| 2014 | $1,300 | $97,050 | $45,100 | $51,950 |
Source: Public Records
Map
Nearby Homes
- 2623 W 3375 S
- 2459 W Glover Ln
- 2467 W 3375 S
- 2448 W Anne Ave
- 3395 S Erin Ave Unit 90
- 3419 S Erin Ave
- 2373 W Howard St
- 3860 S Midland Dr Unit B97
- 3860 S Midland Dr Unit B59
- 3860 S Midland Dr Unit C62
- 3860 S Midland Dr Unit B 51
- 2354 Leigh Ln Unit G26-27
- West Garden Townhome Plan at West Garden
- 3452 S 3100 W Unit 152
- 3444 S 3100 W Unit 154
- 2332 Leigh Ln Unit L48
- 3158 S 2985 W
- 3243 S 2400 W
- 3604 S Macy Ln
- 3130 W 3600 S