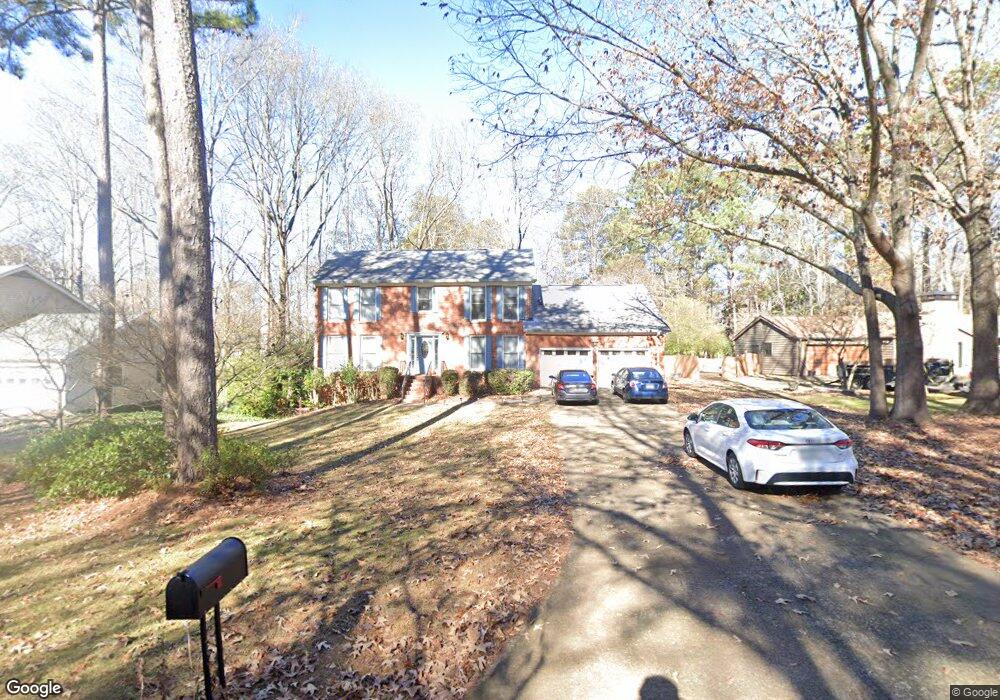
3463 Cedar Valley Ct SE Unit 1 Smyrna, GA 30080
Estimated Value: $512,000 - $626,000
5
Beds
4
Baths
2,480
Sq Ft
$237/Sq Ft
Est. Value
About This Home
This home is located at 3463 Cedar Valley Ct SE Unit 1, Smyrna, GA 30080 and is currently estimated at $588,334, approximately $237 per square foot. 3463 Cedar Valley Ct SE Unit 1 is a home located in Cobb County with nearby schools including Nickajack Elementary School, Griffin Middle School, and Campbell High School.
Ownership History
Date
Name
Owned For
Owner Type
Purchase Details
Closed on
Aug 26, 2022
Sold by
Onsager Nils D
Bought by
Kieruzel Justyna
Current Estimated Value
Home Financials for this Owner
Home Financials are based on the most recent Mortgage that was taken out on this home.
Original Mortgage
$390,000
Outstanding Balance
$372,860
Interest Rate
5.51%
Mortgage Type
New Conventional
Estimated Equity
$215,474
Purchase Details
Closed on
Jul 13, 2022
Sold by
Spinner Richard F
Bought by
Onsager Nils D and Onsager Sarah
Home Financials for this Owner
Home Financials are based on the most recent Mortgage that was taken out on this home.
Original Mortgage
$390,000
Outstanding Balance
$372,860
Interest Rate
5.51%
Mortgage Type
New Conventional
Estimated Equity
$215,474
Purchase Details
Closed on
Nov 12, 1999
Sold by
Rudolph James W and Rudolph Monte K
Bought by
Spinner Richard F
Purchase Details
Closed on
Aug 3, 1996
Sold by
Jones David E
Bought by
Rudolph James W Monte K
Create a Home Valuation Report for This Property
The Home Valuation Report is an in-depth analysis detailing your home's value as well as a comparison with similar homes in the area
Home Values in the Area
Average Home Value in this Area
Purchase History
| Date | Buyer | Sale Price | Title Company |
|---|---|---|---|
| Kieruzel Justyna | $490,000 | -- | |
| Onsager Nils D | -- | -- | |
| Spinner Richard F | $267,200 | -- | |
| Rudolph James W Monte K | $176,000 | -- |
Source: Public Records
Mortgage History
| Date | Status | Borrower | Loan Amount |
|---|---|---|---|
| Open | Kieruzel Justyna | $390,000 | |
| Closed | Rudolph James W Monte K | $0 |
Source: Public Records
Tax History Compared to Growth
Tax History
| Year | Tax Paid | Tax Assessment Tax Assessment Total Assessment is a certain percentage of the fair market value that is determined by local assessors to be the total taxable value of land and additions on the property. | Land | Improvement |
|---|---|---|---|---|
| 2025 | $4,862 | $196,000 | $48,840 | $147,160 |
| 2024 | $4,862 | $196,000 | $48,840 | $147,160 |
| 2023 | $4,373 | $196,000 | $48,840 | $147,160 |
| 2022 | $3,665 | $173,548 | $40,000 | $133,548 |
| 2021 | $3,296 | $152,936 | $40,000 | $112,936 |
| 2020 | $3,296 | $152,936 | $40,000 | $112,936 |
| 2019 | $3,170 | $146,344 | $38,000 | $108,344 |
| 2018 | $2,946 | $134,560 | $38,000 | $96,560 |
| 2017 | $2,831 | $134,560 | $38,000 | $96,560 |
| 2016 | $2,440 | $113,804 | $40,000 | $73,804 |
| 2015 | $2,334 | $105,804 | $32,000 | $73,804 |
| 2014 | $2,147 | $95,152 | $0 | $0 |
Source: Public Records
Map
Nearby Homes
- 1736 Seneca Ct SE
- 1749 Creat Trail SE
- 3485 Navaho Trail SE
- 0 Church St Unit 10397761
- 0 Church St Unit 7473410
- 3444 Vinings North Trail SE
- 3851 Glenhurst Dr SE
- 3505 Commanche Ct SE
- 3412 Archerfield Way
- 3605 Hickory Cir SE
- 3534 Clancy Way Unit 11
- 3365 Vintage Cir SE Unit 5
- 3365 Vintage Cir SE
- 1477 Spruce Dr SE
- 2002 Ivy Ridge Rd SE
- 3351 Vintage Cir SE
- 3522 Ivy Manor Rd SE
- 3230 Collier Gate Ct SE
- 3755 Ashwood Dr SE
- 3463 Cedar Valley Ct SE Unit LG BDRMs
- 3463 Cedar Valley Ct SE Unit LG Bdrm
- 3463 Cedar Valley Ct SE Unit Mstr Bdrm
- 3463 Cedar Valley Ct SE Unit Master BDRM
- 3463 Cedar Valley Ct SE Unit 2&3
- 3465 Cedar Valley Ct SE
- 3461 Cedar Valley Ct SE
- 0 Cedar Valley Ct
- 3469 Cedar Valley Dr
- 3507 Cedar Valley Dr SE Unit 2
- 3469 Cedar Valley Ct SE
- 3509 Cedar Valley Dr SE
- 3468 Cedar Valley Ct SE
- 3464 Cedar Valley Ct SE
- 3462 Shawnee Trail SE
- 3464 Shawnee Trail SE
- 3505 Cedar Valley Dr SE
- 3462 Cedar Valley Ct SE
- 3466 Shawnee Trail SE