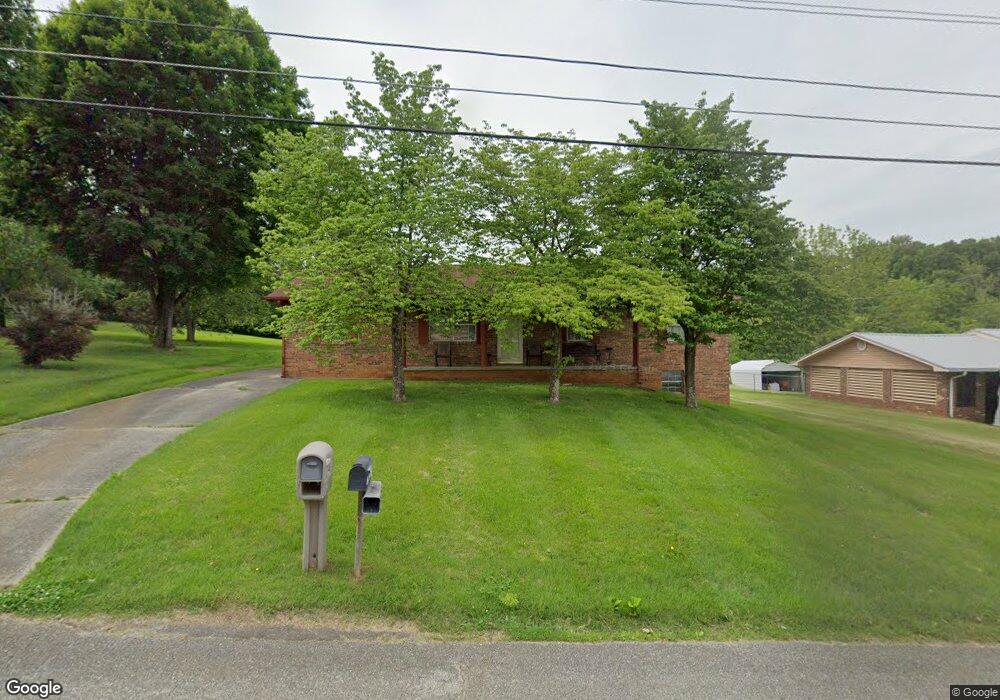
3463 Corbin Dr Morristown, TN 37814
Estimated Value: $236,000 - $319,000
--
Bed
2
Baths
1,512
Sq Ft
$178/Sq Ft
Est. Value
About This Home
This home is located at 3463 Corbin Dr, Morristown, TN 37814 and is currently estimated at $268,744, approximately $177 per square foot. 3463 Corbin Dr is a home located in Hamblen County with nearby schools including John Hay Elementary School, Meadowview Middle School, and Morristown East High School.
Ownership History
Date
Name
Owned For
Owner Type
Purchase Details
Closed on
Sep 22, 2022
Sold by
Cody Stacy L
Bought by
Corbin Land Trust
Current Estimated Value
Home Financials for this Owner
Home Financials are based on the most recent Mortgage that was taken out on this home.
Original Mortgage
$65,000
Outstanding Balance
$30,669
Interest Rate
5.22%
Mortgage Type
Seller Take Back
Estimated Equity
$238,075
Purchase Details
Closed on
May 30, 2012
Sold by
Cody John and Cody Elizabeth
Bought by
John Cody
Home Financials for this Owner
Home Financials are based on the most recent Mortgage that was taken out on this home.
Original Mortgage
$186,000
Interest Rate
2.74%
Mortgage Type
FHA
Purchase Details
Closed on
May 22, 1975
Bought by
Cody John and Cody Elizabeth
Purchase Details
Closed on
Jan 2, 1973
Create a Home Valuation Report for This Property
The Home Valuation Report is an in-depth analysis detailing your home's value as well as a comparison with similar homes in the area
Home Values in the Area
Average Home Value in this Area
Purchase History
| Date | Buyer | Sale Price | Title Company |
|---|---|---|---|
| Corbin Land Trust | $180,000 | Colonial Title Group | |
| Corbin Land Trust | $180,000 | Colonial Title Group | |
| John Cody | -- | -- | |
| Cody John | -- | -- | |
| Cody John | -- | -- | |
| -- | -- | -- |
Source: Public Records
Mortgage History
| Date | Status | Borrower | Loan Amount |
|---|---|---|---|
| Open | Corbin Land Trust | $65,000 | |
| Closed | Corbin Land Trust | $65,000 | |
| Previous Owner | Cody John | $186,000 |
Source: Public Records
Tax History Compared to Growth
Tax History
| Year | Tax Paid | Tax Assessment Tax Assessment Total Assessment is a certain percentage of the fair market value that is determined by local assessors to be the total taxable value of land and additions on the property. | Land | Improvement |
|---|---|---|---|---|
| 2024 | $726 | $36,875 | $6,450 | $30,425 |
| 2023 | $726 | $36,875 | $0 | $0 |
| 2022 | $642 | $36,875 | $6,450 | $30,425 |
| 2021 | $642 | $36,875 | $6,450 | $30,425 |
| 2020 | $642 | $36,875 | $6,450 | $30,425 |
| 2019 | $642 | $32,250 | $7,225 | $25,025 |
| 2018 | $642 | $32,250 | $7,225 | $25,025 |
| 2017 | $642 | $32,250 | $7,225 | $25,025 |
| 2016 | $642 | $32,250 | $7,225 | $25,025 |
| 2015 | $597 | $32,250 | $7,225 | $25,025 |
| 2014 | -- | $32,250 | $7,225 | $25,025 |
| 2013 | -- | $36,075 | $0 | $0 |
Source: Public Records
Map
Nearby Homes
- 3409 Copper Ridge Rd
- 2828 Reeds Chapel Rd
- 0 Brights Pike
- 3835 High Oak Dr
- 3646 Falcon Rd
- 00 N Davy Crockett Pkwy
- Lot 1 N Davy Crockett Pkwy
- 4086 Harbor View Dr
- 2993 Nicole Cir
- 4110 Harbor View Dr
- 4041 Harbor View Dr
- 4146 Leslie Dr
- 3800 Dan Dr
- 2909 Nicole Cir
- 3004 Nicole Cir
- 2998 Nicole Cir
- 1961 Brights View Ln
- 3083 Waters Edge Dr
- 4547 Brights Pike
- 1683 Pebblestone Ct
- 3473 Corbin Dr
- 3466 Corbin Dr
- 3456 Corbin Dr
- 3443 Corbin Dr
- 2610 Joanne Cir
- 3446 Corbin Dr
- 3416 Old Kentucky Rd
- 3433 Corbin Dr
- 3483 Norton Dr
- 3436 Corbin Dr
- 3473 Norton Dr
- 3495 Norton Dr
- 2615 Joanne Cir
- 3493 Corbin Dr
- 3461 Norton Dr
- 3423 Corbin Dr
- 3420 Old Kentucky Rd
- 3426 Corbin Dr
- 3496 Corbin Dr
- 2627 Joanne Cir