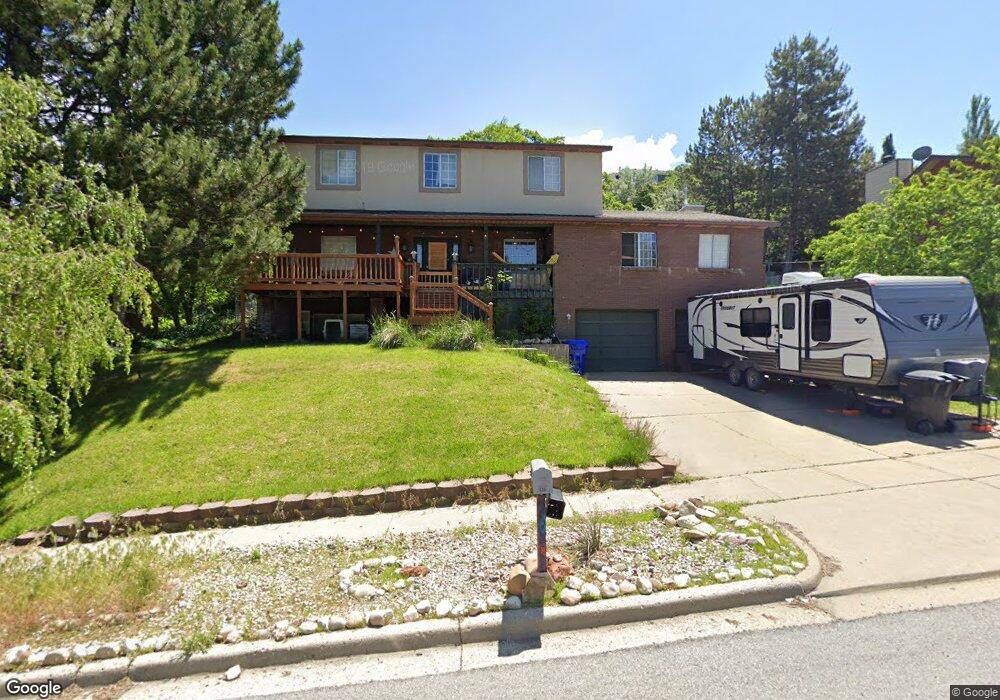
3463 S 400 E Bountiful, UT 84010
Estimated Value: $648,000 - $760,000
5
Beds
3
Baths
3,429
Sq Ft
$203/Sq Ft
Est. Value
About This Home
This home is located at 3463 S 400 E, Bountiful, UT 84010 and is currently estimated at $695,945, approximately $202 per square foot. 3463 S 400 E is a home located in Davis County with nearby schools including Boulton School, Mueller Park Junior High School, and Woods Cross High School.
Ownership History
Date
Name
Owned For
Owner Type
Purchase Details
Closed on
Feb 3, 2012
Sold by
Marland Scott K
Bought by
Marland Scott K and Marland Jennifer D
Current Estimated Value
Home Financials for this Owner
Home Financials are based on the most recent Mortgage that was taken out on this home.
Original Mortgage
$167,000
Outstanding Balance
$114,051
Interest Rate
3.9%
Mortgage Type
New Conventional
Estimated Equity
$581,894
Purchase Details
Closed on
Sep 25, 2004
Sold by
Anderson David Roy and Anderson Jodi J
Bought by
Marland Scott K and Marland Jennifer D
Purchase Details
Closed on
Oct 5, 1998
Sold by
Anderson David Roy
Bought by
Anderson David Roy and Anderson Jodi J
Create a Home Valuation Report for This Property
The Home Valuation Report is an in-depth analysis detailing your home's value as well as a comparison with similar homes in the area
Purchase History
| Date | Buyer | Sale Price | Title Company |
|---|---|---|---|
| Marland Scott K | -- | Bonneville Superior Ti | |
| Marland Scott K | -- | Bonneville Superior Ti | |
| Marland Scott K | -- | Equity Title Agency | |
| Anderson David Roy | -- | Bonneville Title Company Inc |
Source: Public Records
Mortgage History
| Date | Status | Borrower | Loan Amount |
|---|---|---|---|
| Open | Marland Scott K | $167,000 |
Source: Public Records
Tax History
| Year | Tax Paid | Tax Assessment Tax Assessment Total Assessment is a certain percentage of the fair market value that is determined by local assessors to be the total taxable value of land and additions on the property. | Land | Improvement |
|---|---|---|---|---|
| 2025 | $3,573 | $337,150 | $161,808 | $175,342 |
| 2024 | $3,452 | $321,200 | $148,715 | $172,485 |
| 2023 | $3,423 | $584,000 | $275,890 | $308,110 |
| 2022 | $3,268 | $315,151 | $147,791 | $167,360 |
| 2021 | $3,090 | $462,000 | $220,201 | $241,799 |
| 2020 | $2,630 | $409,000 | $157,372 | $251,628 |
| 2019 | $2,777 | $396,000 | $147,899 | $248,101 |
| 2018 | $2,437 | $366,000 | $144,582 | $221,418 |
| 2016 | $2,208 | $167,695 | $55,678 | $112,017 |
| 2015 | $2,075 | $148,500 | $55,678 | $92,822 |
| 2014 | $2,097 | $162,087 | $55,678 | $106,409 |
| 2013 | -- | $154,989 | $44,615 | $110,374 |
Source: Public Records
Map
Nearby Homes
- 424 E Canyon Estates Dr S
- 3759 S Huntington Dr
- 438 Indian Springs Rd
- 3716 S Oakridge Cir
- 8 E 3500 S
- 3893 S Bountiful Blvd
- 3285 S Davis Blvd
- 407 Hidden Lake Dr
- 3252 Sunset Hollow Dr
- 348 Hidden Lake Dr
- 348 Hidden Lake Dr Unit 107
- 4031 Mountain Oaks Dr Unit 308
- 136 E Fairway Dr
- 69 E North Canyon Rd
- 336 W 3500 S
- 19 E North Canyon Rd
- 337 W 2900 S
- 294 Springridge Dr
- 468 W 3200 S
- 53 N Foxhill Rd
- 3435 S 400 E
- 3491 S 400 E
- 3448 Huntington Dr
- 3428 Huntington Dr
- 3417 S 400 E
- 3519 S 400 E
- 3470 Huntington Dr
- 3430 S 400 E
- 3494 S 400 E
- 3494 Huntington Dr
- 3547 S 400 E
- 3403 S 400 E
- 3524 S 400 E
- 3408 Huntington Dr
- 3453 Lexington Dr
- 3402 Lexington Dr
- 3544 Oakridge Dr
- 3475 Lexington Dr
- 3441 Huntington Dr
- 3465 Huntington Dr
Your Personal Tour Guide
Ask me questions while you tour the home.