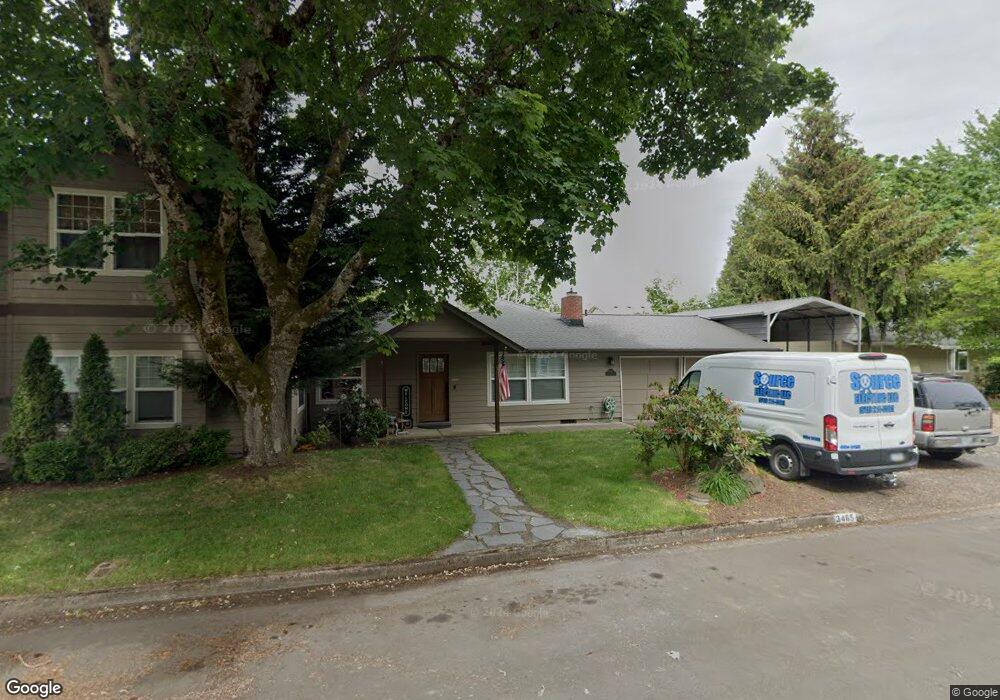
3465 Stark St Eugene, OR 97404
Santa Clara NeighborhoodEstimated Value: $388,000 - $707,000
2
Beds
1
Bath
816
Sq Ft
$687/Sq Ft
Est. Value
About This Home
This home is located at 3465 Stark St, Eugene, OR 97404 and is currently estimated at $560,692, approximately $687 per square foot. 3465 Stark St is a home located in Lane County with nearby schools including Spring Creek Elementary School, Madison Middle School, and North Eugene High School.
Ownership History
Date
Name
Owned For
Owner Type
Purchase Details
Closed on
Dec 22, 2006
Sold by
Riggs Jimmie E and Riggs Mary L
Bought by
Riggs Jimmie E and Riggs Mary L
Current Estimated Value
Home Financials for this Owner
Home Financials are based on the most recent Mortgage that was taken out on this home.
Original Mortgage
$248,700
Outstanding Balance
$147,190
Interest Rate
6.22%
Mortgage Type
New Conventional
Estimated Equity
$413,502
Purchase Details
Closed on
Apr 27, 2001
Sold by
Cameron Richard W and Cameron Lisa E
Bought by
Riggs Jimmie E and Riggs Mary L
Home Financials for this Owner
Home Financials are based on the most recent Mortgage that was taken out on this home.
Original Mortgage
$108,500
Interest Rate
6.98%
Mortgage Type
VA
Create a Home Valuation Report for This Property
The Home Valuation Report is an in-depth analysis detailing your home's value as well as a comparison with similar homes in the area
Home Values in the Area
Average Home Value in this Area
Purchase History
| Date | Buyer | Sale Price | Title Company |
|---|---|---|---|
| Riggs Jimmie E | -- | Fidelity National Title Insu | |
| Riggs Jimmie E | $108,500 | Fidelity National Title Ins |
Source: Public Records
Mortgage History
| Date | Status | Borrower | Loan Amount |
|---|---|---|---|
| Open | Riggs Jimmie E | $248,700 | |
| Closed | Riggs Jimmie E | $108,500 |
Source: Public Records
Tax History
| Year | Tax Paid | Tax Assessment Tax Assessment Total Assessment is a certain percentage of the fair market value that is determined by local assessors to be the total taxable value of land and additions on the property. | Land | Improvement |
|---|---|---|---|---|
| 2025 | $4,485 | $350,420 | -- | -- |
| 2024 | $4,462 | $340,214 | -- | -- |
| 2023 | $4,462 | $330,305 | $0 | $0 |
| 2022 | $4,193 | $320,685 | $0 | $0 |
| 2021 | $3,848 | $311,345 | $0 | $0 |
| 2020 | $3,860 | $302,277 | $0 | $0 |
| 2019 | $3,687 | $293,473 | $0 | $0 |
| 2018 | $3,379 | $276,627 | $0 | $0 |
| 2017 | $3,078 | $276,627 | $0 | $0 |
| 2016 | $2,854 | $268,570 | $0 | $0 |
| 2015 | $2,793 | $260,748 | $0 | $0 |
| 2014 | $2,643 | $253,153 | $0 | $0 |
Source: Public Records
Map
Nearby Homes
- 591 Argon Ave
- 3256 Marvin Dr
- 709 Tyson Ln
- 374 Blackfoot Ave
- 1133 Irvington Dr
- 3985 Shenstone Dr
- 212 Chimney Rock Ln
- 3365 Goose Cross Ln
- 420 Lynnbrook Dr
- 2987 Dry Creek Rd
- 4278 Torrington Ave
- 1256 Frogs Leap Ln
- 329 Dean Ave
- 2965 Teal Place
- 47 van Fossen Ct
- 2721 La Darrah St
- 1265 Napa Creek Dr
- 3470 Cabernet Ln
- 579 Sweetwater Ln
- 2931 Shelby Way
Your Personal Tour Guide
Ask me questions while you tour the home.